


Our current stock allocation is in an Over Weight position. This allocation of stocks vs. bonds is driven by technical market signals. These signals may lead to a shift in stock weightings in SFMG portfolios’ target allocations. This is not a specific allocation recommendation; actual allocations may vary by client.

- Inflation picked up in September, with higher energy costs playing a leading role. The Consumer Price Index (CPI), a widely followed gauge of what households pay for goods and services, rose 0.6% for the month, lifting the annual inflation rate to 3.7% from 3.4% in August. Gasoline prices surged 9.1% and made up more than half of the monthly increase. Core CPI, which leaves out food and energy because those prices swing sharply, rose 0.3%, a bit hotter than economists expected, while prices paid to producers jumped 1.3%, the largest monthly gain since March 2022. With prices still climbing and hiring slowing, the Federal Reserve faces a tougher balancing act between keeping inflation in check and supporting economic growth.
- The Federal Reserve left interest rates unchanged, as expected, in a 10 to 2 vote, with two officials dissenting (voting against the decision). The Fed described economic growth as strong and business investment as robust, and added new language saying it will wait for more information before deciding its next move. Chairman Warsh explained that the rate increase from six weeks ago is still working its way through the economy, that further hikes carry risks for employment, and that the Fed does not want to slow an economy supported by heavy AI related spending. Markets read the decision as leaning toward lower rates, with shorter term Treasury yields falling and the dollar weakening, though we still expect another rate increase in December.
- The Conference Board’s Consumer Confidence Index jumped to 91.7 in October from 84.2, beating expectations as easing gas prices lifted views on current conditions, the outlook, and the job market. In contrast, the University of Michigan’s current conditions index hit its lowest level in 75 years, with the weakness concentrated among households holding few or no stocks. Methodology explains part of the gap, as the Conference Board emphasizes jobs while Michigan is more sensitive to inflation and politics. The ongoing story is a K-shaped divide, with higher income households benefiting from strong markets continuing to spend and keep the economy afloat.

- France is facing a financial and political challenge, with government debt nearing 120% of GDP (the country’s annual economic output). A divided Parliament has struggled to pass the spending cuts or tax increases needed to fix the budget, and protests have added to the uncertainty. Investors have sold French government bonds, pushing the 10 year yield, which is the interest rate the government pays to borrow, to 5%, its highest in more than two decades. French stocks have also fallen, though many large French companies are cushioned because most of their revenue comes from outside France.
- Chinese technology stocks also continue to fall under serious pressure. The STAR 50 Index, which holds the 50 largest and most actively traded companies on Shanghai’s Science and Technology Innovation Board, is down about 40% this year. Prices had climbed on early enthusiasm for artificial intelligence and government support, and the recent global selloff in AI related stocks, along with weak consumer spending at home, accelerated the retreat. We believe the lack of large scale government stimulus and disappointing company earnings are behind the slump, and those elevated valuations may remain vulnerable to further declines.
- The healthcare sector has been a bright spot, with the State Street Health Care Select Sector SPDR ETF (ticker: XLV) reaching an all-time high on October 22, 2026. Analysts expect double-digit earnings growth for the sector from the fourth quarter of 2026 through 2027, a notable improvement for a sector that has lagged the broader market for years. Healthcare stocks may also be benefiting from investors rotating out of high-flying AI and tech names, and the sector’s reputation as “defensive,” meaning it tends to hold up better when markets are uncertain.

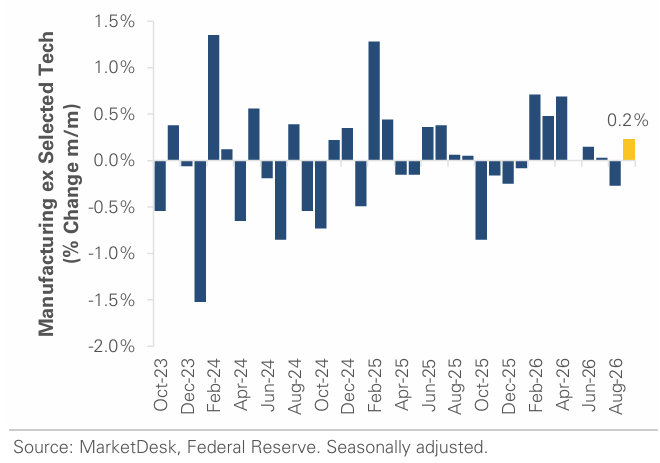
Industrial production increased 0.7% in September, though much of the strength came from the technology sector and the weather. Unusually warm temperatures increased demand for air conditioning, causing electricity and natural gas production by utilities to jump 3.5% and lifting the headline number. Factory output, which gives a clearer picture of manufacturing health, rose a more modest 0.3%. Over the third quarter, production of semiconductors and electronic components grew at a 28.4% annualized pace (meaning the quarterly growth rate projected over a full year), while manufacturing outside of selected high tech industries (highlighted in the chart above) was nearly flat. In short, technology and the AI buildout are carrying much of the load, while the broader manufacturing sector is growing at a slower pace.

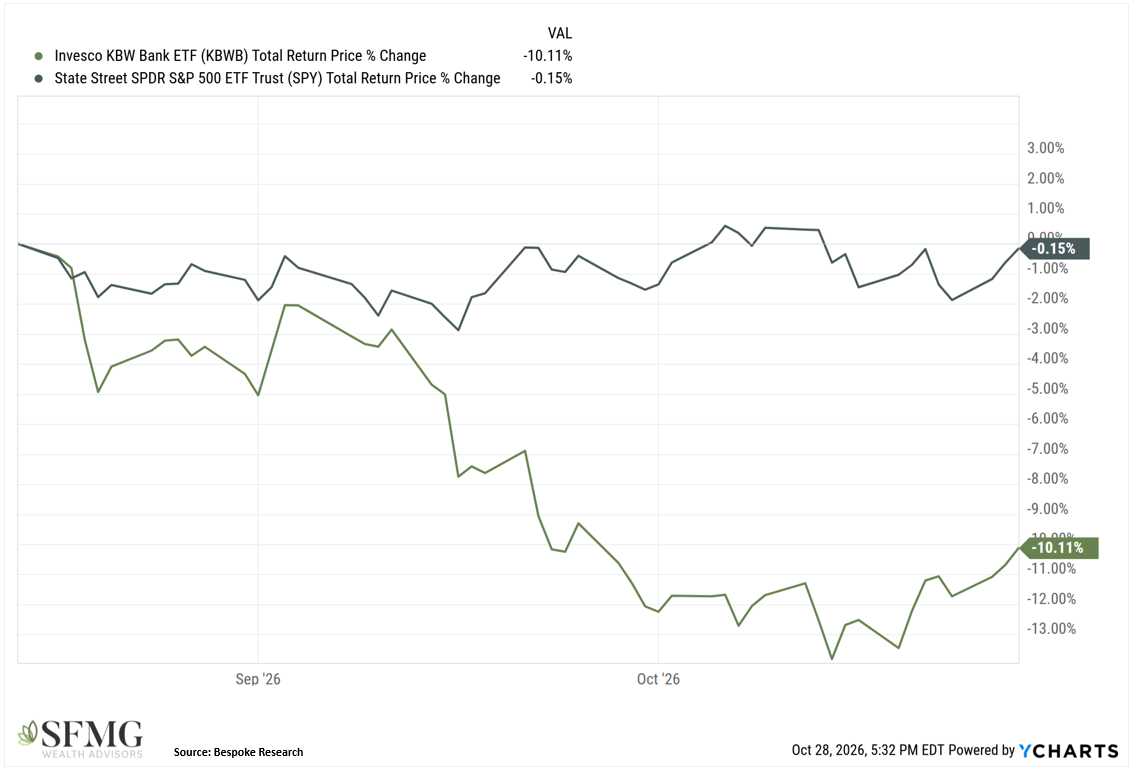
Since the S&P 500 peaked on August 13, it is down only slightly, while the KBW Bank Index (proxy ticker: KBWB), which tracks large U.S. banks and peaked the following day, has fallen more than 10%. Banks had been outperforming the S&P 500 for the year, but their weakness since then lines up with the sharp rise in short term interest rates that accelerated in August. Banks earn money on the gap between what they pay depositors and what they charge borrowers. When short term rates rise, banks must pay more to keep deposits, while the rates on their existing longer term loans and bonds adjust more slowly, so that gap narrows. Higher rates also slow borrowing and raise the risk that some borrowers cannot repay, which hurts loan growth and credit quality. This matters because lending is the fuel line of the economy: when loans flow easily, businesses and consumers can spend and invest, and when lending tightens, growth can slow.

There remains a tug of war between worries about the cost of the artificial intelligence boom and a U.S. economy that continues to show real strength. Industrial stocks came under pressure this month as investors questioned three things at once: how expensive it has become to borrow, whether the enormous sums being spent on AI will earn an adequate return, and whether enough capital exists to fund everyone’s ambitious plans. Those concerns have not slowed the spending itself. The five largest cloud and AI companies, Amazon, Alphabet, Microsoft, Meta, and Oracle, are projected to invest nearly $800 billion in data centers and equipment this year and more than $1 trillion in 2027. In a single week this month, roughly $235 billion in new AI financing was announced, including up to $95 billion from Meta alone. That buildout is showing up in the economic data. Orders for long-lasting manufactured goods rose 1.8% in September, the largest gain in five months, and orders for core business equipment, a closely watched measure of corporate investment, reached another record high, up 13.5% from a year ago. Beyond the economic data, with other major AI players such as Anthropic filing to go public, one thing seems certain: AI will continue to influence markets and remain in the headlines for the foreseeable future. As we enter the final months of the year, history offers some encouragement. Over the past 80 years, the fourth quarter has produced positive returns for the S&P 500 about 80% of the time, more than any other quarter. Midterm election years have been even stronger, with stocks rising in 17 of the last 20 such fourth quarters as markets moved past election uncertainty. That said, seasonal patterns are tendencies rather than guarantees, and several risks could stand in the way of a year-end rally. The Federal Reserve has leaned toward tighter policy, recent market gains have been driven by a relatively narrow group of stocks rather than broad participation, and the current earnings season may fall short of high expectations. We remain encouraged by the strength of the underlying economy but are watching these risks closely.
The purpose of the update is to share some of our current views and research. Although we make every effort to be accurate in our content, the data is derived from other sources. While we believe these sources to be reliable, we cannot guarantee their validity. Charts and tables shown above are for informational purposes, and are not recommendations for investment in any specific security. Forward-looking statements are based on current expectations and assumptions and are subject to risks and uncertainties that may cause actual results to differ materially.