


Our current stock allocation is in an Over Weight position. This allocation of stocks vs. bonds is driven by technical market signals. These signals may lead to a shift in stock weightings in SFMG portfolios’ target allocations. This is not a specific allocation recommendation; actual allocations may vary by client.

- At his second meeting as Fed Chair, Kevin Warsh held rates steady, though three bank presidents dissented in favor of an immediate hike, signaling internal pressure to act if inflation does not improve. Warsh acknowledged the inflation picture is complex despite a broadly solid economy, and reaffirmed the Fed’s commitment to its 2% inflation target. Futures markets are now assigning an 85% chance we see at least one rate hike by year end, if not more.
- Prior to the Fed meeting, inflation cooled in June, with the Consumer Price Index (CPI) falling 0.4%, its largest monthly drop in over six years, pulling the annual rate down to 3.5%. The drop was largely by a nearly 10% decline in gasoline prices, but the reprieve may be short lived, as oil has climbed back to over $80 a barrel since the U.S.-Iran ceasefire broke down in early July.
- U.S. Gross Domestic Product (GDP), the broadest measure of economic growth, moderated in the second quarter, as a surge in AI-related imports (particularly semiconductors) weighed on the headline figure. Because GDP measures domestically produced output, imports are subtracted from the calculation since those goods are made overseas rather than here at home. Beneath the surface, however, the underlying economy remained solid, with consumers continuing to spend and business investment holding firm in IT equipment and software.

- The Nasdaq 100, an index of the 100 largest non-financial technology and growth companies, officially entered correction territory on July 28, meaning it had declined more than 10% from its early June peak, driven by a sharp global selloff in chip and memory stocks. Investor skepticism around whether the massive spending on AI infrastructure can continue to deliver strong returns has been building.
- The S&P 500 has also lost some momentum since the last all-time high reached on June 2nd, and is down 3.86% from that peak through July 29th. The ‘rest of the market,’ however, has performed well. As an example, the Invesco S&P 500 Equal Weight ETF (ticker: RSP), which equally weights the 500 companies in the index instead of weighting them by size (market capitalization) like the traditional S&P 500, has outperformed the index by 7.10% since June 1st. This divergence suggests that while the largest companies have weighed on headline index returns, broader market participation has remained healthy.
- The financial sector has been the second best performing area of the market in the past month just behind energy, up 5.51% from 6/29 – 7/29. Large banks delivered record results in the second quarter, powered by a rush of corporate deals, major IPOs including the $75 billion SpaceX debut, and strong trading profits tied to Middle East-related volatility and the AI boom.

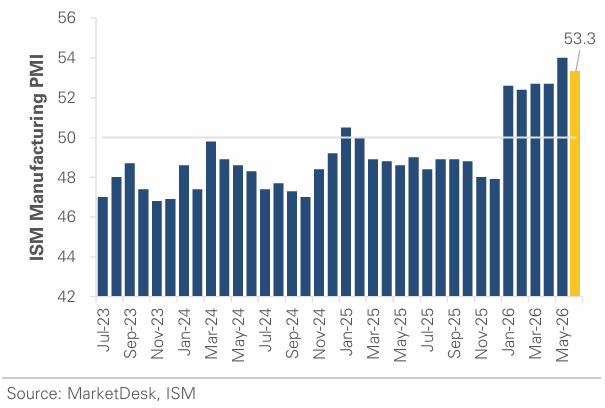
After a long period of contraction, the Institute for Supply Management’s Purchasing Managers’ Index (PMI), a monthly survey of manufacturing firms that measures activity across new orders, production, employment, and prices, showed U.S. factory activity expanding for the sixth consecutive month in June, with a reading of 53.3. Any reading above 50 signals expansion, and while the index remained in healthy territory, new orders and production grew at a slower pace than the prior month, and input prices stayed elevated partly due to oil-related cost pressures tied to the conflict with Iran.

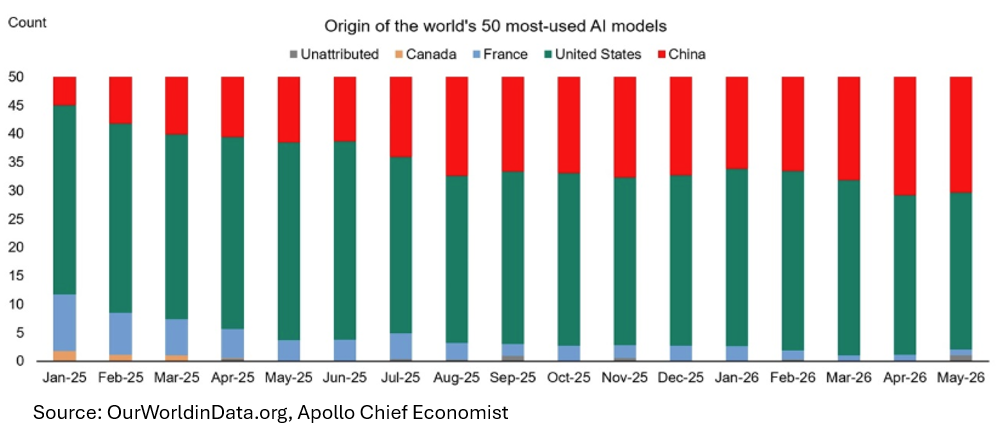
Adding to the volatility in the technology sector has been growing concern that lower-cost Chinese AI models could capture market share from their U.S. counterparts, pressuring the revenue outlook for American AI companies. The chart above illustrates that this has begun to happen. If businesses and developers around the world opt for cheaper Chinese alternatives, U.S. firms may face pricing pressure, forcing them to either cut costs or accept thinner margins to remain competitive. This dynamic also raises broader questions about the long-term return on the massive capital investments U.S. tech companies have made in AI infrastructure, as the value of that spending depends heavily on sustained demand for American AI products and services.

July has been eventful across both equity and fixed income markets, with several major themes competing for investor attention. The S&P 500 and NASDAQ indexes, which have experienced some of the largest gains in the past 12 months, have come under some pressure as some of the AI narrative gets questioned while higher interest rates also create headwinds for stocks. If rates do stay elevated or even move higher, stocks could face additional headwinds for a few reasons. For example, higher borrowing costs make it more expensive for companies to finance operations, expand, or buy back their own stock, all of which can weigh on earnings and valuations over time. Or when bond yields rise, the relatively safe income offered by bonds becomes more attractive compared to the potential returns from stocks, which can lead to a broad-based shift of money out of stocks and into fixed income. Where rates go from here continues to be the question. The combination of sticky inflation, geopolitical uncertainty, and elevated energy costs has left the Fed in a difficult position as it heads into the second half of the year. The 30-year Treasury yield hit its highest level since 2007 following the Fed’s July decision to hold rates steady. The bond market’s reaction signaled concern that the Fed may be falling behind on inflation, pushing the 10-year yield to near 4.70%. In any event, within the stock market, beneath the surface, a notable rotation has taken place, with capital moving out of mega-cap technology and growth stocks and into other sectors and smaller sized companies; a sign that investors may be beginning to price in a genuine global earnings expansion rather than just an AI-driven tech story. We view this as an encouraging sign for the sustainability of the current bull market.
The purpose of the update is to share some of our current views and research. Although we make every effort to be accurate in our content, the data is derived from other sources. While we believe these sources to be reliable, we cannot guarantee their validity. Charts and tables shown above are for informational purposes, and are not recommendations for investment in any specific security. Forward-looking statements are based on current expectations and assumptions and are subject to risks and uncertainties that may cause actual results to differ materially.