

Our current stock allocation is in an Over Weight position. This allocation of stocks vs. bonds is driven by many variables we monitor, including our risk signals. These signals may lead to a shift in stock weightings in SFMG portfolios’ target allocations. This is not meant to be a specific allocation recommendation as this may vary across client portfolios.

- Rating agency Fitch has lowered the U.S.’s credit rating from AAA to AA+, pointing to an expected decline in fiscal health within the next 3 years and ongoing eleventh-hour negotiations over the debt ceiling. The market’s reaction to the downgrade was muted.
- In response to poor economic growth this year, China has implemented more stimulus measures. Their Central Bank has cut one-year loan rates from 3.55% to 3.45%. Despite the stimulus, concerns over China’s housing market are still top of mind.
- July retail sales rose by 0.7%, surpassing consensus expectations of 0.4%. This marked the 4th consecutive uptick and the biggest monthly jump since January. So far, consumer demand for goods remains solid despite higher interest rates and tighter bank lending standards, but eventually those factors should have an impact.

- The yield on U.S. 10-year Treasuries rose to the highest level in 14 years this month, as the bond prices dropped. Better-than-expected economic data, Fed officials’ remarks on potentially hiking rates again this year, and increased amounts of Treasury issuance all contributed to the rise in yields.
- The price of Bitcoin jumped nearly 8% on a court ruling that will require the SEC to review an application for a Bitcoin ETF submitted by crypto firm, Grayscale. Bitcoin is still down over 50% from its peak in November 2021.
- Volatility picked up in August with the S&P 500 dropping 4.78% from 7/31/23—8/18/23. Drivers included August being a historically weak month for markets, higher interest rates, and China’s growth concerns. Still, the index has already gained back over half the decline.

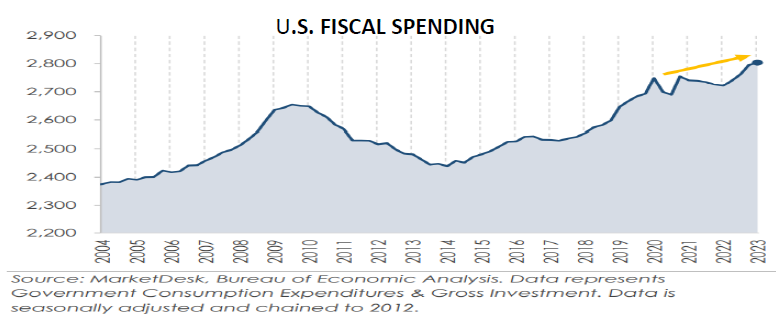
Congress reached a debt ceiling deal in May, but that has not stopped the government’s fiscal spending. Spending on services such as defense and education, and investment in fixed assets like infrastructure rose sharply over the past few quarters. This spending has contributed to the resilient U.S. GDP figures, however it’s likely not sustainable as higher interest rates have increased the government’s funding costs.

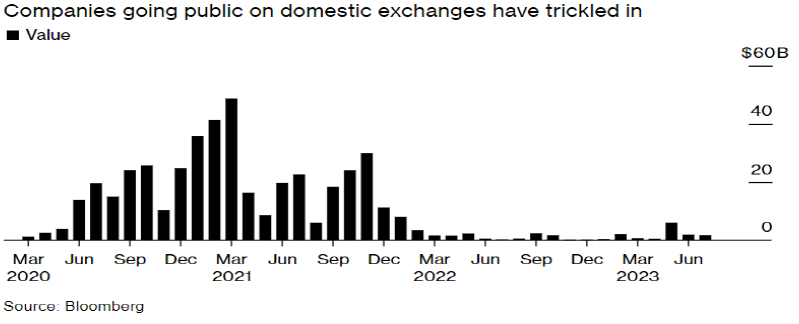
The IPO market in the U.S. has been dormant for 18 months. Only $14.1 billion was raised by companies going public on U.S. exchanges as of 8/7/23, which is a 27% drop from the same time last year and a staggering 94% fall from 2021. Uncertainty around the economic environment and a gap between company valuations and the price investors are willing to pay appear to be the culprits in keeping companies from going public lately.

So far, the Federal Reserve has not seen enough yet to clearly state they are comfortable with any reversal in their restrictive monetary policies. Fed Chair Jerome Powell’s opening remarks at their Jackson Hole symposium signaled their commitment to keeping rates high to get inflation even lower. Powell stated they also stand ready to raise rates further if appropriate and necessary to get inflation down to their 2% target. The forecasts for U.S. economic growth are not helping the cause. The Atlanta Fed’s ‘GDPNow’ model is estimating 3rd quarter real GDP to rise to 5.8%. Although their estimates often overshoot, it provides more evidence that the economy may not slow much at all in 2023, which could keep inflation elevated and the Fed steadfast. But with consumer credit card debt rising, defaults beginning to tick higher in both the consumer and corporate sector, and a few recent reports showing a less robust labor market, we are watching closely for a change in sentiment that could add pressure to the market’s impressive 2023 rally.
The purpose of the update is to share some of our current views and research. Although we make every effort to be accurate in our content, the data is derived from other sources. While we believe these sources to be reliable, we cannot guarantee their validity. Charts and tables shown above are for informational purposes, and are not recommendations for investment in any specific security.