

Our current stock allocation is in an Over Weight position. This allocation of stocks vs. bonds is driven by many variables we monitor, including our risk signals. These signals may lead to a shift in stock weightings in SFMG portfolios’ target allocations. This is not meant to be a specific allocation recommendation as this may vary across client portfolios.

- A U.S. government shutdown could occur if Congress misses the October 1, 2025, funding deadline, temporarily halting non-essential federal services as lawmakers remain divided over budget proposals. Historically, shutdowns cause short-term disruptions, such as delays in economic data and temporary market volatility, but have minimal lasting effects on economic growth or stock market performance. This shutdown could differ, however, due to the Trump Administration’s approach: agencies are being asked to identify non-essential workers who could be permanently laid off, forcing Democrats to weigh job cuts against using the budget standoff to push for higher spending.
- U.S. retail sales surged 0.6% in August, beating expectations and marking a three-month winning streak—the strongest average growth since June 2022. Core sales, which exclude volatile categories like autos, gas, and building materials, rose 0.7%, also above forecasts, while July sales were revised up to 0.6% from 0.5%. Some of the strength reflects higher prices and possible front-loading ahead of tariffs, particularly for durable goods. Despite a softer labor market, demand remains broad-based, underscoring a resilient consumer.
- Pending home sales jumped 4.0% in August, the strongest gain in four months, as lower mortgage rates boosted housing demand. Sales were also up 3.8% year-over-year, the fastest pace since last November. While activity remains near historic lows, the rebound offers a modestly positive outlook for existing home sales in the near term.

- Bond prices rose as Treasury yields fell in September ahead of the Federal Reserve’s expected rate cut. The 2-year yield, highly sensitive to monetary policy, has dropped over 0.30% since the end of July. Longer-term rates, such as the 10-year yield, which are more sensitive to economic growth and inflation, have also declined. Despite recent labor market weakness pushing yields lower, ongoing concerns over government spending and tariff pressures could drive long-term yields higher, particularly for the 30-year Treasury.
- Chinese stocks (measured by the iShares MSCI China ETF, ticker: MCHI) have been a top-performing sector in September, rising over 6%. While some of the rally can be attributed to optimism around Chinese government support and easing regulatory pressures, much of the recent momentum has been driven by the same artificial intelligence frenzy occurring in the U.S.
- For the first time this decade, hedged inflows into U.S. securities exceed unhedged inflows from abroad, according to analysts at Deutsche Bank. The U.S. dollar has fallen more than 10% this year, making 2025 its weakest year in over two decades. In response, global investors have rushed to hedge against further weakness, with estimates suggesting up to $1 trillion in dollar-hedged positions now in place.


Breaking down employment growth into tariff-affected and unaffected sectors reveals that the slowdown is broad-based, with job growth in tariff-exposed sectors now turning negative. Blue-collar industries have been disproportionately impacted, as many companies pause hiring in response to tariffs. In August, layoffs were particularly high in goods-producing sectors most affected by trade disruptions, with manufacturing, construction, and energy and mining collectively losing 25,000 jobs.

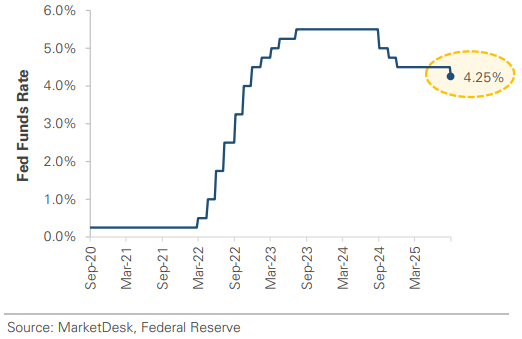
The FOMC lowered rates by 25 basis points, bringing the target range down to 4.00–4.25%, marking the first cut of 2025. The Fed indicated that two additional cuts could follow at the remaining meetings in October and December. In its post-meeting statement, the committee highlighted recent weakness in the labor market, noting that “job gains have slowed, and the unemployment rate has edged up but remains low.” The statement also emphasized that economic activity has “moderated” and inflation “has moved up and remains somewhat elevated.”

The economy and financial markets are navigating a complex landscape with several competing forces at play. The job market is showing signs of strain. For the first time since early 2021, there are now more people seeking employment than available positions. While recent employment data supports the Federal Reserve’s decision to cut interest rates, the situation is delicate. Rate cuts may not provide the expected economic boost, as households often lose interest income faster than their borrowing costs decline. Despite these challenges, markets have held up well. The banking system remains robust and consumer balance sheets are strong, making a widespread credit crisis unlikely. Large technology companies continue to benefit from AI-related growth, and we’re seeing encouraging signs of smaller companies beginning to outperform as investors anticipate they’ll benefit from lower interest rates. Still, markets are priced for an optimistic scenario: a soft economic landing, continued earnings growth, sustained AI investment, and supportive Fed policy. While this outcome is possible, elevated expectations and stock valuations leave little room for disappointment, especially with the level of market concentration in the U.S. Following the ongoing AI-led surge, the largest 10 companies in the S&P 500 together now account for 40% of the index. Against this backdrop, we remain cautiously optimistic. Supportive monetary policy and resilient fundamentals justify staying invested, but market concentration and high expectations argue for balance. We continue to favor diversification over momentum—broadening exposure beyond U.S. mega-cap tech into international markets and sectors where valuations and expectations are less stretched.
The purpose of the update is to share some of our current views and research. Although we make every effort to be accurate in our content, the data is derived from other sources. While we believe these sources to be reliable, we cannot guarantee their validity. Charts and tables shown above are for informational purposes, and are not recommendations for investment in any specific security.