

Our current stock allocation is in an Over Weight position. This allocation of stocks vs. bonds is driven by many variables we monitor, including our risk signals. These signals may lead to a shift in stock weightings in SFMG portfolios’ target allocations. This is not meant to be a specific allocation recommendation as this may vary across client portfolios.

- Moody’s downgraded the U.S. credit rating by one level, removing the country’s final AAA rating from the three major credit agencies (with S&P having downgraded in 2011 and Fitch in 2023). The downgrade was driven by concerns over unsustainable fiscal deficits, growing interest costs, and the rising national debt. Moody’s also highlighted ongoing political dysfunction, including recurring debt ceiling standoffs and the absence of a credible long-term fiscal strategy.
- On 5/28, the U.S. Court of International Trade ruled that most of President Donald Trump’s recent tariffs—covering broad imports from China, Mexico, and other nations—were unlawful. The court determined that Trump overstepped his authority under the International Emergency Economic Powers Act (IEEPA). The Trump administration quickly appealed, and a federal appeals court temporarily blocked the ruling, allowing the tariffs to stay in effect at least until June 9, when further hearings will take place.
- The S&P Global Flash U.S. Composite PMI rose by 1.5 points to 52.1 in May, indicating a return to moderate growth after near-stagnation in April. Both manufacturing and services sectors showed improvement, suggesting the economy remains resilient despite ongoing tariffs and policy uncertainty. The uptick in activity earlier this year was linked to inventory stocking ahead of potential tariffs, but the latest increase reflects broader underlying strength. However, the report also noted rising price pressures, keeping concerns about higher input costs in play.

- After a sharp 18.9% drop driven by steep tariffs, the S&P 500 rebounded 19.7% between April 8 and May 19, following the pause of those significant tariffs. While it has since pulled back slightly, the index remains above its pre-tariff levels.
- Oil prices declined last week following reports that OPEC+ plans to increase production by 411,000 barrels per day in July, despite softening demand for fossil fuels. Unexpected rises in U.S. crude and fuel inventories added further pressure. As a result, WTI dropped to $61.53 per barrel and Brent to $64.78. The lower resulting gas prices should be a welcome tailwind for consumers traveling for the summer.
- Solar stocks dropped sharply in May after the House passed President Trump’s tax-and-spending bill, which threatens clean-energy tax credits from the Biden era. The bill would phase out incentives from the Inflation Reduction Act and tighten eligibility rules, especially for projects using Chinese materials. On 5/22, solar related stocks such as Enphase Energy and Sunrun fell 19.63% and 37.05%, respectively, reflecting fears of weakened demand.

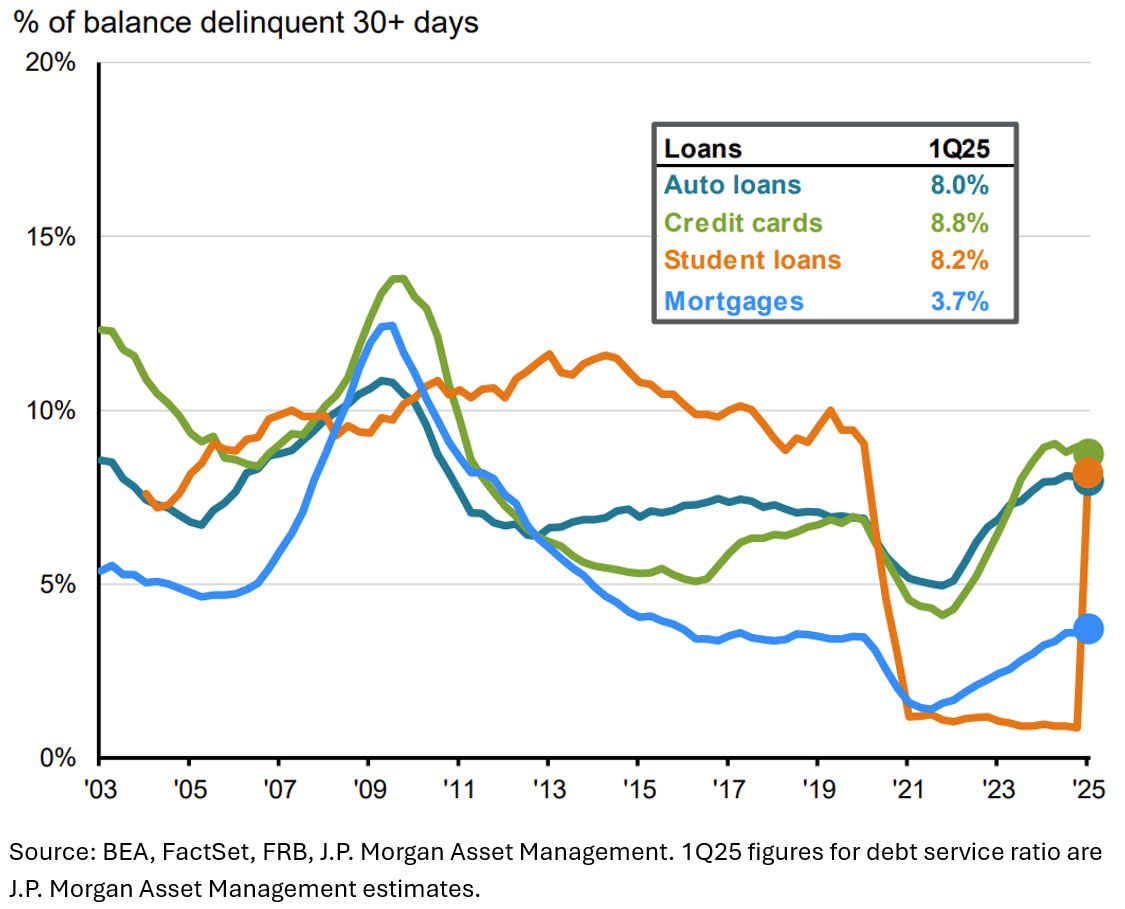
On May 5, the U.S. Department of Education resumed collections on defaulted federal student loans, leading to a sharp rise in delinquencies—from 0.9% in 4Q24 to 8.2% in 1Q25. This surge has already hurt credit scores, particularly affecting the 43% (about 2.4 million borrowers) who previously had prime credit. These borrowers will now face higher borrowing costs, likely reducing consumer spending. While this alone is not likely to trigger a recession, it will tighten credit conditions and cut into disposable income for many.

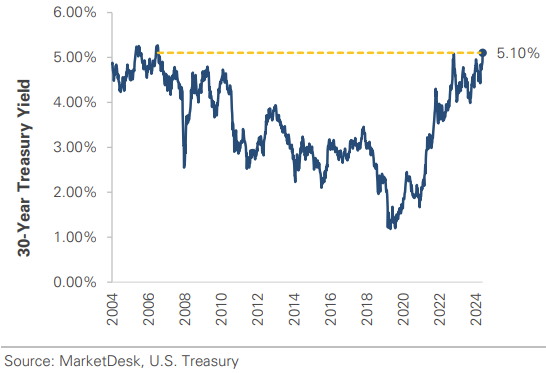
The 30-year Treasury yield climbed above 5% on May 21st, reaching levels not seen since early 2007. Rising yields can be a positive sign when driven by strong growth expectations. However, an increase stemming from policy or fiscal issues, is concerning. Tax cuts could potentially stimulate growth, but markets are currently focused on the growing deficit.

The market’s rebound from the April lows amid tariff de-escalation has been nothing short of extraordinary. The strength and speed of the rally rival the rebound seen after the depths of COVID-induced volatility, when the Fed intervened with stimulus measures and interest rate cuts. Although many tariff levels were rolled back, the S&P 500 returned to pre-tariff levels—even with several 10% baseline and sector-specific tariffs still in place. While the full impact of these tariffs has yet to be realized, it’s notable that market pricing and valuations have returned to, or even exceeded, levels from before any tariffs were imposed. This may reflect market anticipation of the recent U.S. Court of International Trade ruling, which could lead to further tariff reductions. As legal proceedings unfold, we expect continued uncertainty around trade policy, especially as the administration is likely to pursue new tariffs through alternative channels or non-tariff measures. For now, however, markets appear to have grown largely indifferent to tariff headlines. That said, equity markets may struggle to ignore warning signs emerging from the bond market. The recent rise in long-term Treasury yields was driven in part by the House passing a sweeping reconciliation bill expected to significantly increase the federal deficit and add trillions to the national debt over the next decade. The additional government borrowing required to fund this spending has raised concerns about a surge in Treasury supply, which could push yields even higher. Rising interest rates—whether caused by tariff-driven inflation or fiscal concerns—could ultimately act as a headwind for U.S. equities. We remain mindful of these risks, which is why we continue to favor maintaining meaningful exposure to non-U.S. markets. The ‘worst-case scenario’ on tariffs, which markets seemed to be pricing in back in April, may now be behind us. So, while we respect the current market momentum, we continue to expect a choppy path forward.
The purpose of the update is to share some of our current views and research. Although we make every effort to be accurate in our content, the data is derived from other sources. While we believe these sources to be reliable, we cannot guarantee their validity. Charts and tables shown above are for informational purposes, and are not recommendations for investment in any specific security.