

Our current stock allocation is in an Over Weight position. This allocation of stocks vs. bonds is driven by technical market signals. These signals may lead to a shift in stock weightings in SFMG portfolios’ target allocations. This is not meant to be a specific allocation recommendation as this may vary across client portfolios.

- Iran has rejected the U.S.’s 15-point peace plan while signaling mixed intentions, maintaining control of the Strait of Hormuz but allowing more tankers through as a potential goodwill gesture. With diplomacy ongoing and a pause on U.S. strikes extended to April 6, the U.S. is also reportedly preparing military options targeting key Iranian oil assets if talks fail. Headlines continue to change daily, however, with President Trump most recently signaling a willingness to attempt to end the war without a formal agreement to keep the Strait of Hormuz open.
- The Producer Price Index (PPI), which measures prices received by producers for goods and services, rose 0.7% in February, well above expectations and the largest gain in seven months. The increase was driven by sharp gains in goods, especially food and energy, along with a notable rise in services costs, which are less impacted by tariffs. This points to broader inflation pressures that could be further amplified by higher oil prices in the months ahead.
- The University of Michigan Consumer Sentiment Index fell 3.3 points in March to a weaker-than-expected 53.3, near its record low, as the Iran conflict and rising oil prices weighed on confidence. Both current conditions and expectations deteriorated, with expectations seeing their sharpest drop since last year. This reflects a worsening outlook for the economy and personal finances, particularly among higher-income consumers, and signals downside risk to near-term spending and growth.

- The Nasdaq Composite entered correction territory Thursday, falling more than 10% from its Oct. 29 peak, as tech sharply underperformed amid rising artificial intelligence concerns following OpenAI’s pullback in infrastructure spending. This has raised worries that planned investments may not materialize and has cast doubt on the market’s ability to rely on its most important sector for support.
- Oil prices have risen over 50% since the war with Iran began on 2/28/26, and the impact extends beyond energy. The Strait of Hormuz is a key route for global agriculture, handling roughly a quarter of the world’s fertilizer exports. Any sustained disruption could delay shipments, increase costs, and ultimately lead to weaker crop yields and higher food prices.
- Rising inflation expectations are making interest rate cuts less likely and increasing the chance of future rate hikes, which has supported a stronger U.S. dollar. The dollar has risen more than 3% since the war began, while major currencies like the euro, pound, and yen have weakened due to their greater sensitivity to higher oil costs. Despite recent moves, the dollar is not yet at levels that typically create meaningful headwinds for corporate earnings.

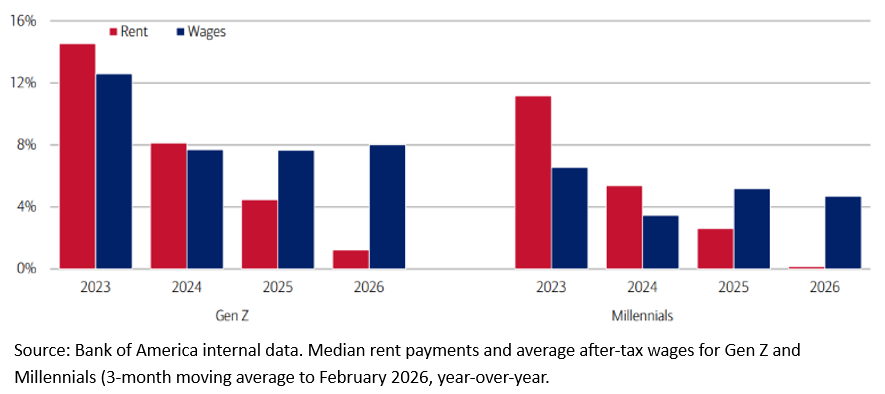
There’s some encouraging news for younger renters. Bank of America data suggests median rent growth for Gen Z and Millennials has slowed sharply over the past two years, after the surge in 2023 and 2024. Even better, after-tax wage growth for these groups is now running ahead of rent increases, which is a welcome shift since housing usually takes the biggest bite out of household budgets. This extra breathing room is important, especially as gas prices rise. Younger consumers tend to spend a larger share of discretionary income on fuel, so if pump prices stay elevated, they could start to squeeze spending on non-essentials such as travel and electronics.

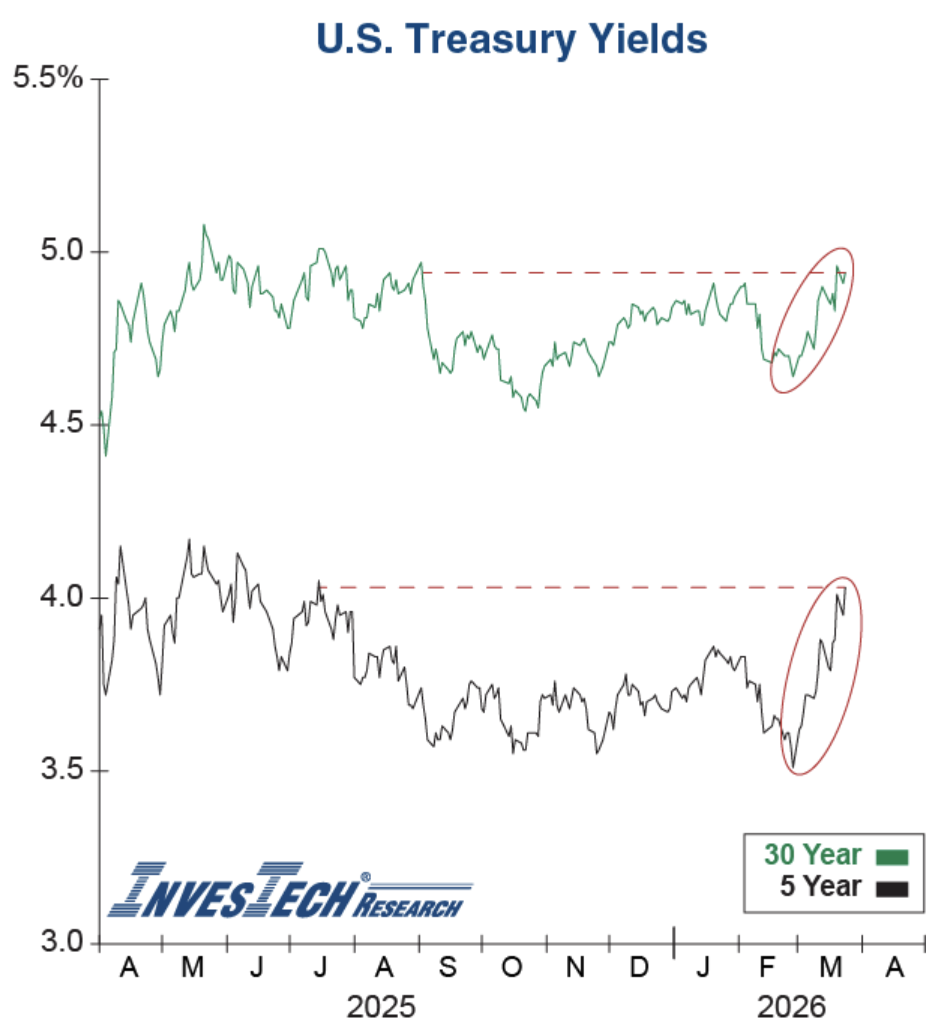
The Fed controls short-term rates, but the bond market is harder to tame. When large institutional bond holders worry inflation is reaccelerating, they sell bonds, pushing yields higher and lifting long-term borrowing costs even without a Fed move. That means financial conditions can tighten on their own. In March, rising oil prices and renewed inflation fears have pushed Treasury yields up, with the 5-year moving more than half a percentage point higher and the 30-year nearing 5.0%. If yields keep climbing, the effects could spread across the economy. Housing would face more pressure, and the private credit market could come under additional strain as borrowing costs rise.

The S&P 500 has declined for five consecutive weeks amid multiple headwinds, including the conflict with Iran, private credit pressures, and ongoing uncertainties around artificial intelligence. While media coverage has focused largely on the war, all three risks are impacting the market and require monitoring. Equities are trading inversely to oil, and prices above $100 per barrel have weighed on the market. Private credit has come under pressure due to rising interest rates and concerns over loans made specifically to software companies, a popular sector for many private credit funds. Markets are grappling with the risk that these companies could be disrupted by AI, potentially reducing their ability to repay those loans. While concerning, these issues remain largely sector-specific rather than systemic. AI-related worries also persist, including doubts over returns on massive investments. We expect private credit and AI concerns could linger, but the Iran conflict, at least, has the potential to resolve in the near term and trigger a rebound. For markets to stabilize, investors need tangible signs of de-escalation, such as direct U.S.-Iran talks or credible restraint signals, rather than social media updates. Meanwhile, economic data will be closely watched for signs of stagflation, as rising prices and slowing growth may drive additional volatility. Our positioning in less-volatile, AI -resilient, and high-cash-flow-sectors is designed to help manage downside risk while keeping portfolios positioned for potential rebounds.
The purpose of the update is to share some of our current views and research. Although we make every effort to be accurate in our content, the data is derived from other sources. While we believe these sources to be reliable, we cannot guarantee their validity. Charts and tables shown above are for informational purposes, and are not recommendations for investment in any specific security. Forward-looking statements are based on current expectations and assumptions and are subject to risks and uncertainties that may cause actual results to differ materially.