


Our current stock allocation is in an Over Weight position. This allocation of stocks vs. bonds is driven by many variables we monitor, including our risk signals. These signals may lead to a shift in stock weightings in SFMG portfolios’ target allocations. This is not meant to be a specific allocation recommendation as this may vary across client portfolios.

- The European Central Bank (ECB) raised its policy interest rate to 3.5% and indicated another increase in July was likely. ECB forecasts show that core inflation is projected to reach 5.1% by the end of the year, exceeding the bank’s 2% target.
- First quarter U.S. Gross Domestic Product was revised even higher, up to 2.0% from the previous estimate of 1.3%.This surpassed the consensus estimate of 1.4% and marked the largest beat since Q4 2021. The increase was primarily due to strong revisions in net exports and consumer spending.
- Still, leading economic indicators signal slower growth ahead. The Conference Board’s Leading Economic Index (LEI) dropped 0.7% in May, marking its 14th consecutive decline. Though a recession hasn’t materialized as anticipated, investors still expect weakness ahead due to the impact of higher interest rates on the economy.

- The S&P 500 has entered into a technical bull market, defined as a 20% rise from its October 2022 low. However, other areas beyond the S&P 500, like small cap stocks still have some catching up to do. The Russell 2000 index, a proxy for smaller companies has only experienced an 11% increase from its low on 9/26/22.
- The Dow Jones Transports Index (a basket of economically sensitive stocks) has begun to provide some healthy confirmation in June. The index is up 11.8% in June vs the S&P 500’s 4.25%, as of 6/29/23.
- Bank stocks are still recovering from the regional bank crisis. PacWest Bancorp, a troubled bank, made news by selling $3.5 billion in loans to investment asset manager Ares Management this week. Deals like these, which can strengthen banks’ balance sheets, may help avoid any more significant bank failures.

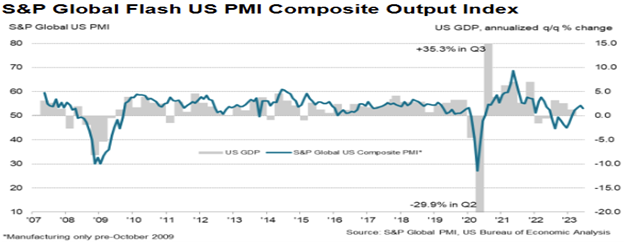
U.S. companies indicated a continued expansion of business activity in the 2nd quarter, but the pace of growth slowed to a 3 month low. Manufacturing experienced a contraction in production, while the service sector saw a slower but steady increase in output. Despite higher wages affecting costs, inflation in selling prices for goods and services reached a 32-month low.

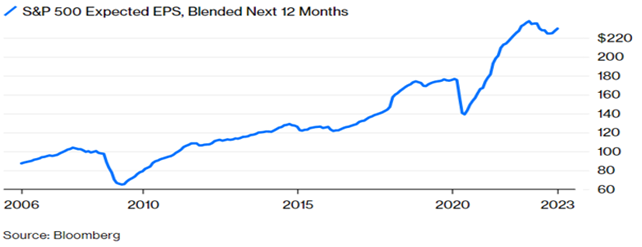
The S&P 500 experienced a correction in earnings throughout 2022, but so far in 2023, the declines have stabilized. While there may be some overly optimistic analyst views, the rising earnings expectations may be based on corporations’ ability to navigate the environment of higher rates and higher inflation better than expected. This has contributed in part to the bounce back in markets.

Stronger housing data, ongoing labor market strength, and resilient consumer spending continue to push back against the narrative of an impending recession. These factors, along with positive earnings revisions and significant optimism surrounding Artificial Intelligence (AI), have contributed to double-digit year-to-date gains for the S&P 500. However, it will be challenging to accurately quantify the extent of AI’s impact on productivity and output at this early stage. Consequently, some of the optimism may dissipate, and a market pause seems likely. Furthermore, sustaining the strength in the labor market and consumer spending may become increasingly challenging as post-pandemic savings dwindle and job openings decline. So, as we enter the second half of the year, it will be important to moderate expectations. We believe companies with strong balance sheets, ample free cash flow, competitive advantages within their peer group, and more international exposure may help weather a slowdown after a strong first half of the year, primarily driven by U.S. large-cap tech companies.
The purpose of the update is to share some of our current views and research. Although we make every effort to be accurate in our content, the data is derived from other sources. While we believe these sources to be reliable, we cannot guarantee their validity. Charts and tables shown above are for informational purposes, and are not recommendations for investment in any specific security.