

Our current stock allocation is in an Over Weight position. This allocation of stocks vs. bonds is driven by many variables we monitor, including our risk signals. These signals may lead to a shift in stock weightings in SFMG portfolios’ target allocations. This is not meant to be a specific allocation recommendation as this may vary across client portfolios.

- The “One Big Beautiful Bill Act” (OBBBA) has been enacted into law as President Trump’s flagship comprehensive legislation, introducing wide-ranging economic reforms across the United States. While the law incorporates growth-oriented policies that favor investors and businesses, it simultaneously adds pressure to the nation’s already substantial federal debt burden, despite offsetting revenue from tariffs.
- June employment figures (Nonfarm payrolls) increased by 147,000, surpassing the expected gain of 110,000. While the headlines highlighted the strong overall jobs number, most of the hiring came from a sizable—and likely temporary—increase of 73,000 jobs in state and local government. In contrast, private sector job growth slowed noticeably, with private payrolls adding just 74,000 jobs. That’s about half the increase seen in the previous month and marks the smallest monthly gain for the private sector in eight months.
- Second quarter economic growth (measured by Gross Domestic Product) rose an impressive 3.0% annualized, largely driven by a sharp rebound in net trade, which contributed 5.0 percentage points. Consumer spending grew a modest 1.4%, easing after prior quarters were inflated by tariff-driven stockpiling. Business investment also remained soft, rising just 1.9% amid ongoing trade policy uncertainty.

- Copper prices surged 13% on July 8th to a record $5.70 per pound after President Trump announced a 50% tariff on all imported copper starting August 1st. The news raised concerns about rising costs across industries that rely on the metal, including electronics, construction, and automotive manufacturing. The White House eventually clarified that the tariffs would apply only to semi-finished copper products. Prices reversed sharply, with futures contracts falling roughly 20% on July 30th, marking the largest one-day drop on record.
- Japanese equities, proxied by the MSCI Japan ETF (EWJ) surged to record highs on July 23rd, on news of a comprehensive U.S.-Japan trade agreement. The deal lowered tariffs on Japanese exports, including autos, to 15%, avoiding the previously threatened 25–30% rates and boosting investor confidence.
- Technical signals suggest that momentum in U.S. large-cap stocks may be fading. As of July 28th, the S&P 500 has gone 18 consecutive trading days in the third quarter without a gain of 1% or more. This compares to last quarter, when the index saw moves of 1% or more in 10 out of 62 trading days, or roughly 16% of the time.

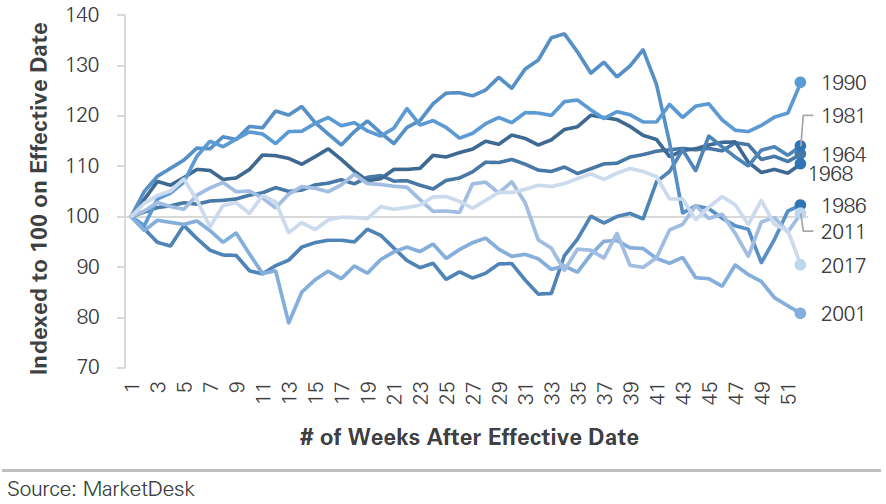
The chart above plots the historical movements of the S&P 500 in the 12 months following tax policy changes. The data shows no clear link between tax policy changes and market performance. The strongest and weakest returns followed tax increases (1990) and cuts (2001), respectively, highlighting that while tax policy can affect investor sentiment, the broader macro environment plays a larger role.

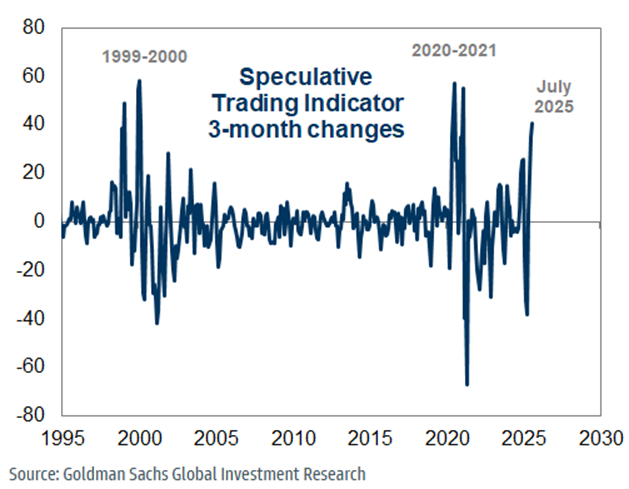
As the S&P 500 reaches record highs, caution remains warranted amid rising optimism and speculative activity. Goldman Sachs’ “Speculative Trading Indicator” has climbed to its highest level since the COVID-era market frenzy. The surge reflects increased trading in high-risk assets—such as unprofitable companies, overvalued ‘meme stocks’, digital assets, and niche tech sectors like quantum computing—driven by strong investor demand for momentum plays. While elevated speculation doesn’t necessarily signal an imminent drawdown, it increases the risk of a sharper unwind if a negative catalyst emerges.

Second quarter earnings season is progressing better than expected, with roughly 30% of S&P 500 companies having reported and over 80% beating estimates. Financials are delivering the biggest upside surprises, driven by strong trading and deal activity, while tech firms are reinforcing enthusiasm around AI through robust results and forward-looking capital spending plans. However, not all sectors are benefiting—many companies in the retail and broader consumer discretionary sector are revising guidance lower in response to rising tariff impacts, which remain a growing headwind. Although there have been several trade deals announced with key partners, overall tariff levels remain elevated and only slightly below the peak levels proposed in April that triggered significant market volatility. The Trump administration has effectively established a 15% minimum tariff floor, and estimates suggest the average U.S. import tariff rate now stands near 20%. While this is lower than the April 2nd “Liberation Day” peak of 32%, it still poses a meaningful economic headwind. At the same time, inflationary pressures are creeping higher. June’s CPI rose to 2.7% year-over-year—the highest in four months—while core inflation (excluding food and energy) climbed to 2.9%. Much of the increase is being driven by tariff-affected imported goods like apparel, furniture, and electronics, many of which are now facing some of the steepest tariffs since the 1930s. Equity markets have remained resilient so far, supported by solid earnings and positive sentiment around recently announced trade deals, but we caution that even with progress on trade negotiations, the effective tariff rate is likely to remain in the high teens, continuing to pressure global trade and business sentiment.
The purpose of the update is to share some of our current views and research. Although we make every effort to be accurate in our content, the data is derived from other sources. While we believe these sources to be reliable, we cannot guarantee their validity. Charts and tables shown above are for informational purposes, and are not recommendations for investment in any specific security.