
Our current stock allocation is in an Over Weight position. This allocation of stocks vs. bonds is driven by many variables we monitor, including our risk signals. These signals may lead to a shift in stock weightings in SFMG portfolios’ target allocations. This is not meant to be a specific allocation recommendation as this may vary across client portfolios.

- The Federal Reserve lifted the Fed Funds rate another 0.25%, bringing the range to 5.25% – 5.50%, a 22-year high. Chairman Jerome Powell stated future rate hike decisions will be made meeting-by-meeting and they will still be data dependent. He did state rate cuts in the next year are unlikely.
- Initial readings of second quarter economic growth in the U.S. rose to a 2.4% annual rate, up from 2.0% in the first quarter. Growth has continued to exceed consensus expectations as consumer spending, investment, and government spending remain high.
- Initial claims for unemployment insurance fell by 7,000 jobs in the week ending July 22nd. Claims have declined for three consecutive weeks and hit a 5-month low. Continued labor market strength is one reason the Fed now expects a slowdown, but not a recession.

- Gasoline prices have reached an 8-month high in July. Part of the rise is likely due to an unexpected outage at one of Exxon Mobil’s refineries. As supply declines and prices rise going into summer driving season, gasoline could be an unplanned source of inflation in coming months.
- Stocks other than big tech companies have begun to participate more in the ongoing market rally. The S&P 500 is market-cap weighted, meaning the largest tech companies carry more weight. However, in the past month (6/28/23—7/28/23), the equal weighted S&P 500 fund (ticker: RSP), which highlights performance of more average sized stocks, has performed better, rising 4.91%.
- The Dow Jones Industrial Average ended a streak of 13 consecutive daily gains in July, which was the longest win streak since 1987 and the second longest on record.


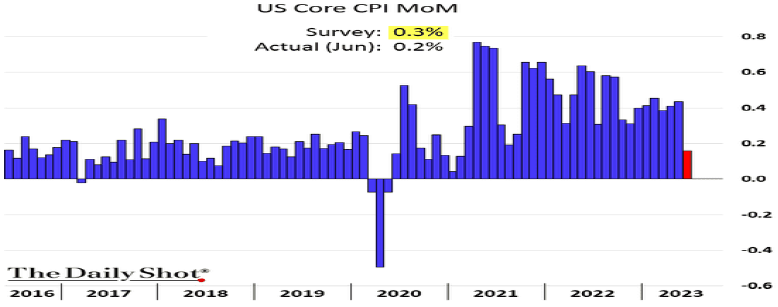
June’s Consumer Price Index (CPI) reading showed core prices (excluding food and energy), rose by 0.16% compared to the previous month, the smallest increase since February 2021 and less than consensus estimate of 0.3%. Shelter costs remain a large component of the price increases, however the pace has been slowing, so further declines are expected if that trend continues.


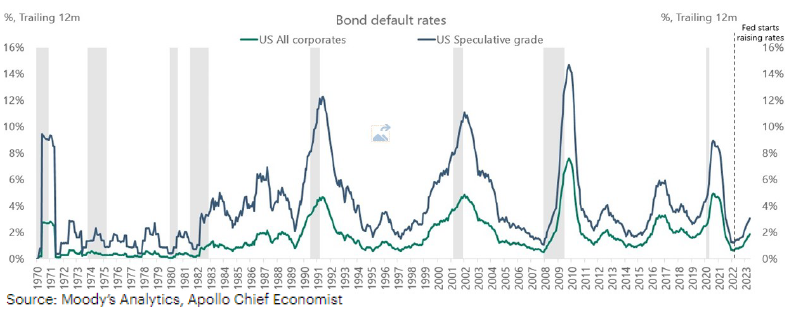
Defaults in the corporate bond market have begun to rise as interest rates begin to show their impact. Higher financing costs have pressured the weaker companies the most, illustrated by speculative grade bonds, i.e. junk bonds / high yield bonds, default rates reaching nearly 4%. Defaults for the entire corporate bond universe are still relatively low, but this will be an important trend to keep an eye on.

Between now and the next Federal Reserve meeting in September, the Fed will be able to view two more inflation (CPI) reports, two more labor reports (non-farm payrolls), and more data on employee wages. These factors should determine whether or not this month’s rate hike was the last that the markets and economy will need to endure. The Fed is still looking for inflation to fall further to their 2% target and for the labor market and wages to weaken to feel confident the economy will not overheat, leading to a potential inflation resurgence. Meanwhile, markets appear to be optimistic that the Fed may be threading the needle in combatting inflation while avoiding a recession. As a result, the S&P 500 is now within 5% of reaching its all-time high level from January 2022. However with valuations sitting at above average levels, sustained improvements to corporate earnings results will likely be necessary to keep the momentum going. So far, second quarter results have held up, but the hurdle in future quarters may be higher as higher financing costs and higher wage costs pressure margins. This could occur at the same time inflation declines further and companies’ ability to pass costs on to the consumers becomes more difficult.
The purpose of the update is to share some of our current views and research. Although we make every effort to be accurate in our content, the data is derived from other sources. While we believe these sources to be reliable, we cannot guarantee their validity. Charts and tables shown above are for informational purposes, and are not recommendations for investment in any specific security.
