

Our current stock allocation is in an Over Weight position. This allocation of stocks vs. bonds is driven by technical market signals. These signals may lead to a shift in stock weightings in SFMG portfolios’ target allocations. This is not meant to be a specific allocation recommendation as this may vary across client portfolios.

- The ISM Services PMI—compiled by the Institute for Supply Management and based on surveys of purchasing managers to gauge business activity in the U.S.—rose 1.8 points in December to 54.4, its highest level since October 2024 and above consensus. Readings above 50 indicate expansion, and the increase signals a notable acceleration in services activity at year-end. The expansion, the fastest in over a year, was driven by solid demand and improved hiring, consistent with continued economic growth.
- U.S. existing home sales rose 5.1% in December to an above-consensus annualized pace of 4.35 million—the highest since February 2023 and the largest monthly increase in nearly two years. Lower mortgage rates and moderating price growth have helped drive the four-month streak of gains, the longest since 2020.
- The U.S. Supreme Court has continued to delay their ruling on the legality of President Trump’s tariffs and recently noted that February 20th may be the next potential meeting for a decision. Meanwhile, tariff rhetoric has ratcheted higher as President Trump announced that 10% tariffs would take effect on February 1st for all imports from Denmark, Norway, Sweden, France, Germany, the U.K., the Netherlands, and Finland, rising to 25% in June. He noted the tariffs would remain in place until an agreement is reached for the complete and total purchase of Greenland.

- The technology sector, as measured by the NASDAQ, has taken a breather, with the index last reaching a high at the end of October (10/29/25). Despite this pause in tech leadership, broader markets have remained resilient as strength in Industrials, Materials, and Healthcare has helped offset the slowdown.
- Earnings season began with the major banks, and three of the four largest U.S. banks reported broadly positive results, supported by solid net interest income growth and improving credit quality. While forward estimates were revised higher, bank stocks still experienced some volatility amid proposals from the Trump administration to cap credit card rates.
- Defense stocks have had a strong start to the year in both the U.S. and Europe. U.S. defense stocks are largely benefitting from President Trump’s recent call for military spending to be increased by 50%. While in Europe, in addition to the ongoing war between Russia and Ukraine, markets are betting that defense spending will also need to be increased following the U.S.’s intervention in Venezuela, and the administration’s comments that military action would not be ruled out in an effort to take control of Greenland.

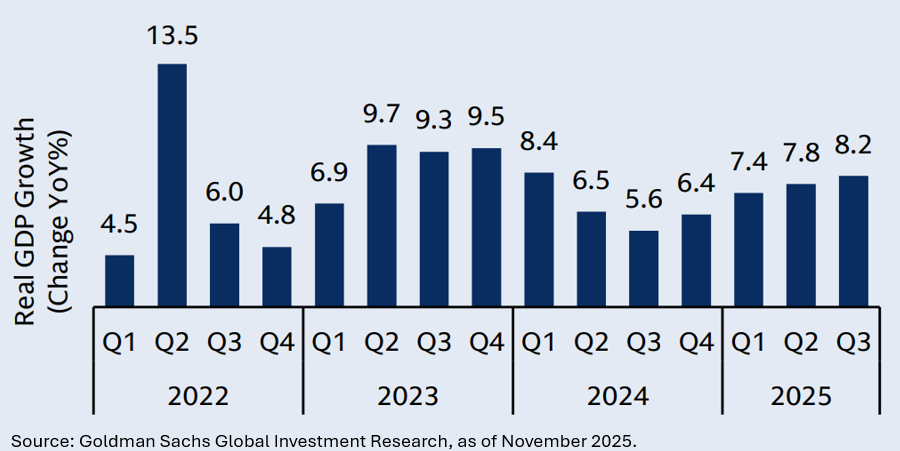
India remains among the fastest-growing major economies, though equities underperformed for much of 2025 amid earnings deceleration, elevated valuations, and foreign capital outflows. Despite these near-term headwinds, we see India’s long-term outlook as compelling, supported by structural tailwinds such as favorable demographics, accelerating digitization, and ongoing regulatory reforms. Looking ahead, earnings growth could reaccelerate in 2026–27 alongside continued GDP momentum, which has trended higher since 3Q24. Key risks include persistent trade tensions, although a potential U.S.–India agreement could serve as a positive catalyst.

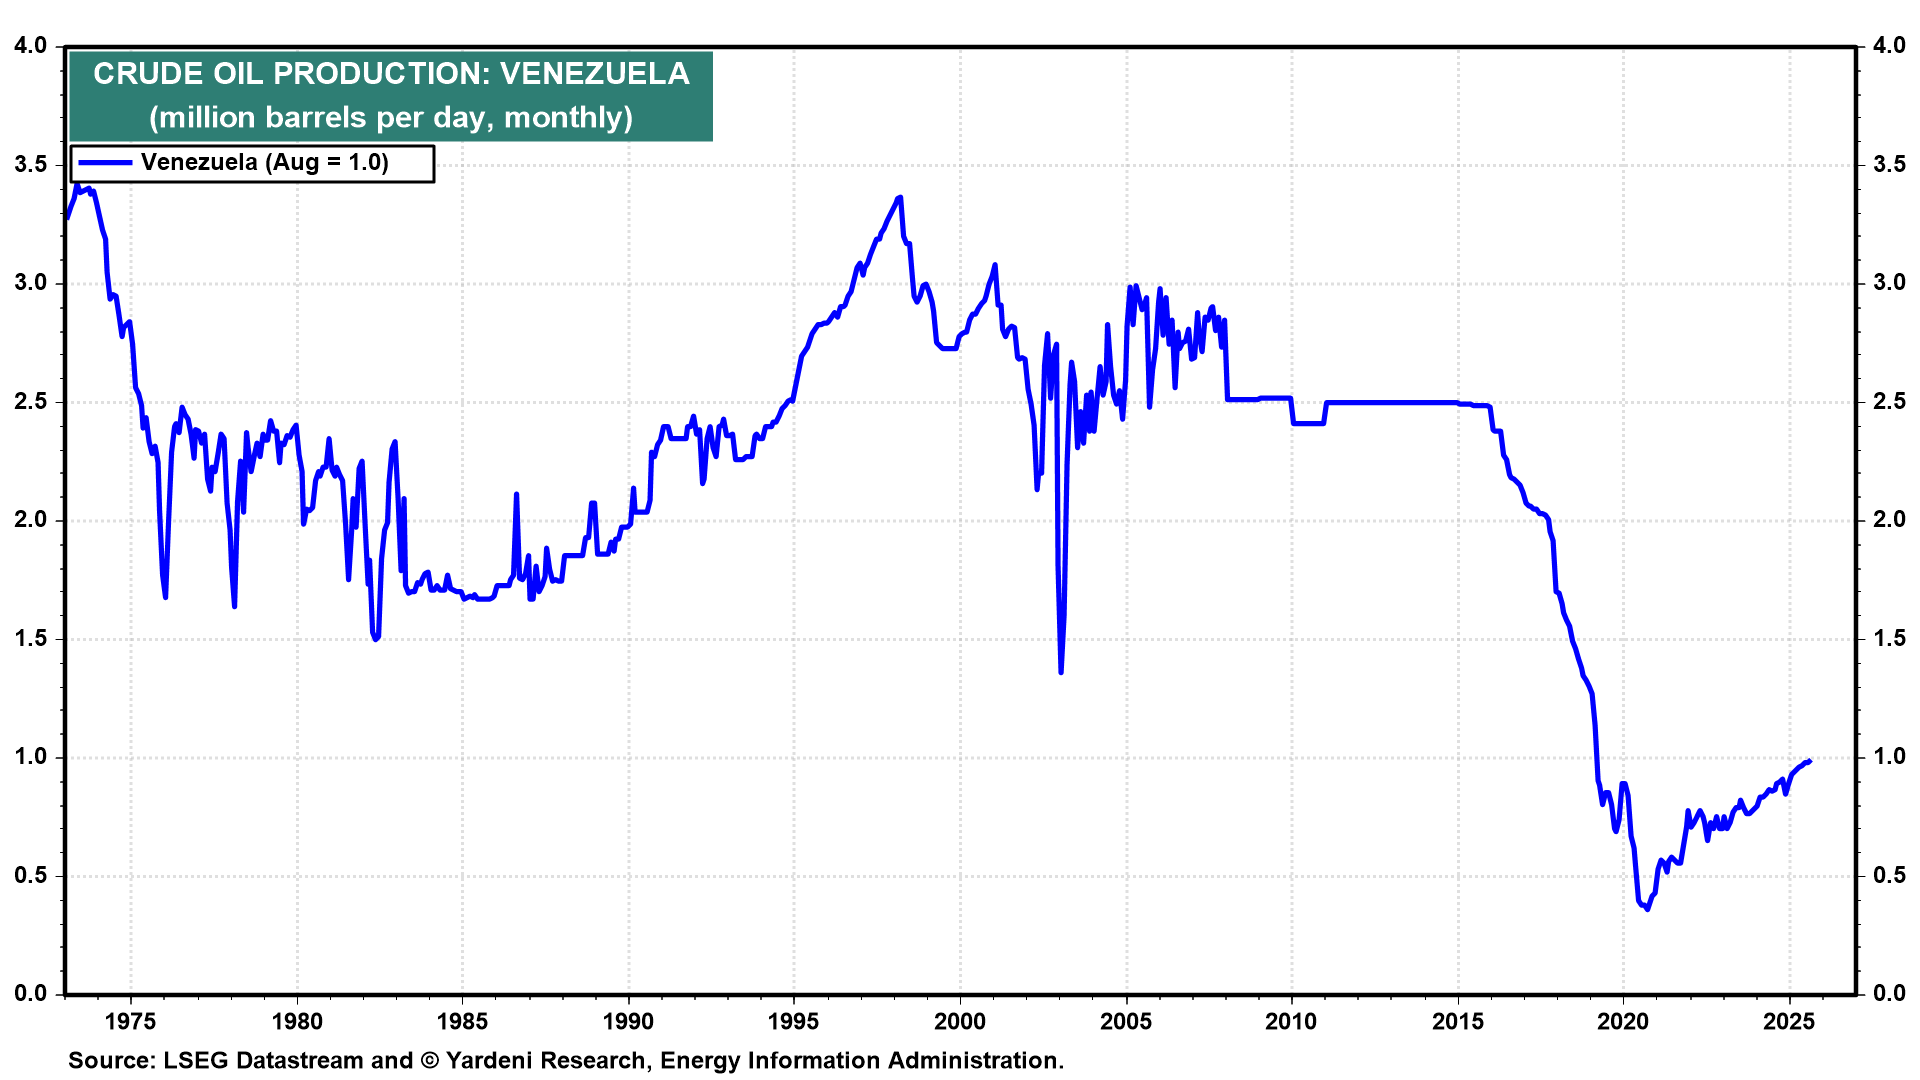
Oil prices have stayed relatively steady around $60/barrel, after the U.S. military operation that captured Venezuelan President Nicolás Maduro in early January 2026. The move, which involved strikes on Venezuelan territory and the transfer of Maduro to U.S. custody, has curtailed Venezuela’s oil exports, especially to China and Cuba, but broader crude markets remain well supplied, keeping a lid on price spikes. Venezuela has the world’s largest proven oil reserves, but production has collapsed in recent years under sanctions and underinvestment, meaning any meaningful increase in output under U.S. control will likely take years—helping explain the muted market response.

Stock and bond prices have already experienced a modest dose of volatility early in the new year. A number of geopolitical events and policy headlines have caused the broader market to waver, while also having both positive and negative impacts on stocks in specific sectors and industries. So far, these moves have been short-lived, as markets continue to wrestle with how much of what the administration is proposing can or will actually happen versus what is simply part of negotiations. In the bond markets, there has been notable movement as well. The 10-year Treasury yield recently rose to a five-month high of 4.30% (as of 1/20/26). With many pro-growth policies set to take effect in 2026, an already resilient and growing economy, and the Fed cutting rates, inflation appears primed to reemerge. Longer-term rates, such as the 10-year Treasury yield—which are more influenced by expectations around growth and inflation—have remained elevated even as the Fed cuts short-term rates. This suggests that bond markets may view inflation as a continued and underappreciated risk. Despite the geopolitical environment becoming more heated and the persistence of risks in an already highly valued market, there is still reason to be cautiously optimistic. We continue to be encouraged by market leadership beneath the surface. Areas such as small caps, value, and equal-weight indexes are outperforming mega-cap technology, signaling a healthier bull market. However, if policy-related uncertainty remains persistent, markets are unlikely to remain immune to larger volatility swings. Should that occur, we believe our quality bias and focus on fundamentals such as valuations should result in a smoother ride for portfolios.
The purpose of the update is to share some of our current views and research. Although we make every effort to be accurate in our content, the data is derived from other sources. While we believe these sources to be reliable, we cannot guarantee their validity. Charts and tables shown above are for informational purposes, and are not recommendations for investment in any specific security.