

- U.S. Gross Domestic Product (GDP) in the 4th quarter was positive and confirmed the economy was not in a recession. Real GDP (inflation-adjusted) showed growth of 2.9%, beating consensus expectations of 2.8%, but slower than the 3.2% pace in the 3rd quarter.
- Homebuilder sentiment, measured by the NAHB/Wells Fargo Housing Market Index (HMI), rose for the first time in 13 months. The improvement comes amid lower mortgage rates, which are down from a high of 7.2%, however elevated construction costs and affordability conditions for buyers remain major headwinds.
- Retail sales in the U.S. sank in December, down 1.1%, the most in a year. Following the decline in November, this capped off the worst two-month drop in retail sales since the lockdowns in April 2020.

- Lumber prices are up over 30% so far this year in response to some renewed optimism in the housing market. U.S. pending home sales rose in December, breaking a 6 month streak of declines in new contracts. Although the jump in lumber is significant, this comes on the heels of approximately a 70% decline in prices in 2022.
- There has also been some optimism in equity markets, illustrated by sector leadership to start the year. Sectors such as Consumer Staples, Healthcare, and Utilities are the only sectors with negative returns in January, down roughly 2-3%, indicating less interest across the market for traditionally defensive investments.
- Corporate bonds have gotten off on a solid foot in 2023 following the most difficult year in decades. The iShares Investment Grade Corporate Bond ETF (ticker: LQD) is up 4.41%, in addition to generating a near 5% annualized yield.


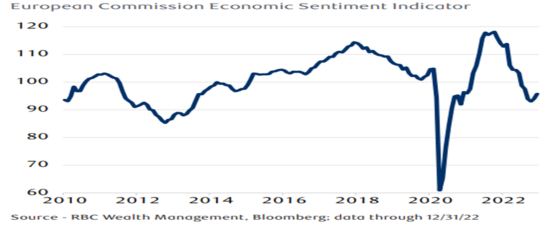
Consumer and business sentiment for the economy in Europe has improved slightly as initial expectations for a severe recession in the region subside. Warmer weather has resulted in sufficient gas storage and a significant decline in natural gas prices, a benefit for energy costs and inflation. Still, Europe faces growth challenges. The region barely maintained positive growth in the 4th quarter, up just 0.1%.


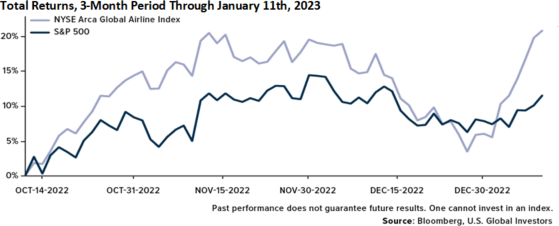
Despite some challenges with winter weather, delays, and cancellations, airline stocks have had a strong start to earnings season. Many airlines are citing robust demand despite fears of a slowdown in consumer spending. The chart above shows that in the past 3 months, the NYSE Arca Global Airline Index (a proxy for global airline stocks) is up over 22%, with a large jump to start 2023.

Although growth in the U.S. mostly surprised to the upside in the second half of 2022, the momentum is clearly slowing. Leading economic indicators still point to increasing risk of an economic recession. But for now, the market appears to be looking past that in anticipation for continued trends in declining inflation and potentially a less aggressive Federal Reserve. The first two-day Federal Reserve meeting of 2023 takes place January 31st and February 1st and may provide some insight as to whether or not the market is getting ahead of itself. The expectation is for a slower pace of interest rate hikes, i.e. the Fed raises just 0.25% following a string of 0.50% and 0.75% in past meetings. The more important information will come in the form of Jerome Powell’s commentary on the strength of the labor market, how they are interpreting the inflation data, and whether there is a change to their still aggressive stance. Beyond the Fed news, the U.S. debt ceiling debate is once again coming into focus. The decision of Congress to raise the debt ceiling and what sort of spending reform both parties will accept will be a difficult negotiation process. Although the limit has technically already been reached, the Treasury will use measures to pay current obligations until June, when a more permanent decision will need to be agreed upon. The risk in the near term could be similar to 2011, when faltering negotiations resulted in the S&P rating agency downgrading U.S. debt from a triple-A rating. This would likely stir up volatility in both stock and bond markets.
The purpose of the update is to share some of our current views and research. Although we make every effort to be accurate in our content, the data is derived from other sources. While we believe these sources to be reliable, we cannot guarantee their validity. Charts and tables shown above are for informational purposes, and are not recommendations for investment in any specific security.
