

Our current stock allocation is in an Over Weight position. This allocation of stocks vs. bonds is driven by many variables we monitor, including our risk signals. These signals may lead to a shift in stock weightings in SFMG portfolios’ target allocations. This is not meant to be a specific allocation recommendation as this may vary across client portfolios.

- Despite the full effect of tariffs not yet being passed through to consumers, multiple inflation readings still showed signs of picking up in July. The Personal Consumption Expenditures (PCE) Price Index rose to 2.6%, while Core PCE—the Fed’s preferred gauge, which excludes volatile food and energy prices—remained elevated at 2.8% year-over-year. Meanwhile, the Producer Price Index (PPI), which measures wholesale prices paid to producers and often leads consumer inflation trends, surged 3.3% year-over-year and 0.9% month-over-month, signaling continued upward pressure on consumer prices.
- The Conference Board’s CEO Confidence Index rebounded 15 points in the 3rd quarter to 49, the largest gain since 4th quarter 2020, following easing tariff tensions. Recession expectations dropped sharply, with 36% of CEOs now anticipating a downturn in the next 12–18 months versus 83% last quarter. However, overall confidence remains below the neutral level of 50 and still marks the second-lowest reading since the end of 2023. Under the surface, caution persists, as more CEOs plan to reduce headcount than expand it for the first time since 2020.
- President Donald Trump announced on 8/11/25 that he signed an executive order extending the tariff truce with China for an additional 90 days, pushing the deadline to November 10. Under the extension, U.S. tariffs on Chinese goods will remain at 30%, while China will keep its 10% duties on U.S. products, with all other terms staying the same.

- Concentration within the S&P 500 has increased, with the two largest stocks making up 15% of the index, the highest level since 1980, and the top four accounting for 25%. Nvidia now holds the biggest individual weight in the S&P 500 since records began in 1981, underscoring the market’s extreme Artificial Intelligence-driven concentration. While these stocks continue to show strong fundamentals and upward momentum, the broader index’s performance is increasingly reliant on a few high-valuation names, leaving it vulnerable to pullbacks if their growth outlook weakens.
- Meanwhile, other areas of the market may be starting to gain momentum, reversing some of the weakness seen earlier in the year. For example, smaller company stocks, as measured by the S&P 600 Small Cap Index, have risen 9.27% as of 8/27/25, their highest level in over six months, compared to the S&P 500’s 3.90% return in August. The rally was likely driven in part by expectations of interest rate cuts, which could lower financing costs for these smaller companies, improving earnings, along with deregulation trends and a rotation away from high-performing sectors like Technology.
- Corporate stock buybacks are hitting record highs, with July announcements 88% higher than the same time last year. Buybacks, in which a company repurchases its own shares, can signal that executives believe the stock is undervalued, but in today’s richly valued market, they may also reflect caution. Executives tend to boost dividends when confident but rely on buybacks when uncertain. The weak dividend growth in 2025, alongside soaring buybacks, suggests that while corporate performance has been strong, companies remain wary about the future.

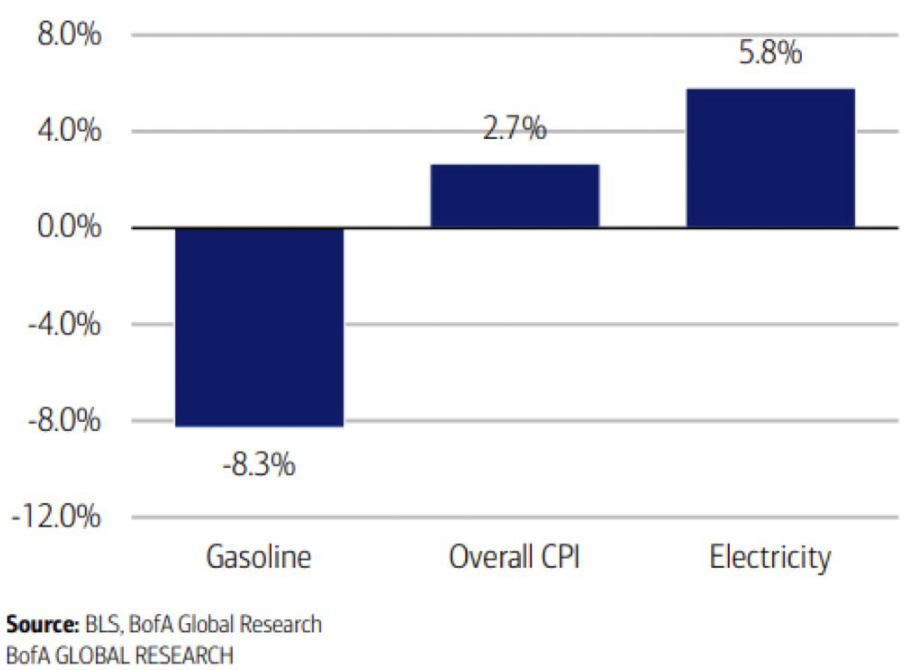
The chart above shows the year-over-year June 2025 Consumer Price Index inflation data. U.S. electricity prices have been rising, with the year-over-year inflation rate reaching 5.8%, up from 3.8% in January, according to Bank of America Institute. Increased electricity demand from artificial intelligence, industrial onshoring, and consumer adoption of electric vehicles and heat pumps are boosting costs. Analysts note that the growth of data centers and AI computing could require an additional 18–28 gigawatt of generation capacity by 2026, putting further upward pressure on prices. Overall, rising industrial and technological demand is driving sustained electricity cost growth.


Stocks often experience seasonal weakness moving through the third quarter into early fourth quarter, a trend that is particularly common in the first year of a new U.S. administration. The chart illustrates the movement of the Dow Jones Industrial Average and Nasdaq indices so far in 2025, with the dashed lines showing how the indices have performed on average over the past four years in late August and September. This pattern can be driven by several factors, including profit-taking after strong first-half performance, lower summer trading volumes, and portfolio rebalancing by institutional investors. However, these seasonal pullbacks have historically been short-lived, making them more of an interesting phenomenon than a concern for long-term investors.

Markets pushed higher in August, driven most recently by Federal Reserve signals and shifting economic data. At the Kansas City Fed’s annual Jackson Hole meeting, Fed Chair Jerome Powell suggested that the balance of economic risks “may warrant” an adjustment in policy, citing rising downside risks to employment while noting that tariff-driven inflationary pressures should be short-lived. Following his remarks, markets sharply raised expectations for monetary easing, with futures pricing in an 80% probability of a 0.25% rate cut at the upcoming September 17th meeting and projecting roughly 2.2 cuts across the remaining three Fed meetings this year. This marked a notable shift from the July FOMC minutes, which reflected greater concern about inflation over July’s weaker-than-expected jobs report. In addition to the employment picture beginning to worry the Fed, consumer spending data continues to look challenged. Areas of discretionary spending, including motor vehicles, sporting goods, clothing, and restaurants have slowed compared to last year. And even if the tariff-related price increases are a “one-time shift” upward, higher prices will likely weigh on spending. While it’s been encouraging to see broader participation in the market rally, much of the optimism around rate cuts appears priced in already. If the recent sluggishness in economic data doesn’t improve, volatility could pick back up as investors question whether the Fed’s cuts will be too little, too late.
The purpose of the update is to share some of our current views and research. Although we make every effort to be accurate in our content, the data is derived from other sources. While we believe these sources to be reliable, we cannot guarantee their validity. Charts and tables shown above are for informational purposes, and are not recommendations for investment in any specific security.