

Our current stock allocation is in an Over Weight position. This allocation of stocks vs. bonds is driven by many variables we monitor, including our risk signals. These signals may lead to a shift in stock weightings in SFMG portfolios’ target allocations. This is not meant to be a specific allocation recommendation as this may vary across client portfolios.

- Most economic reports continue to show slowing growth in the U.S. The Conference Board’s index of leading economic indicators dropped for the 29th consecutive month in July, and the Purchasing Managers Index (measure of manufacturing activity) decreased further from 49.6 in July to 48.0 in August, signaling contractionary conditions (as readings below 50 indicate).
- The Labor Department reported that the U.S. added -818,000 fewer jobs than initially estimated between April 2023 and March 2024. The negative adjustment was the second largest revision in the history of the data set. It highlights underlying weakness in the labor market that was not previously reported. The weakness should strengthen the Federal Reserve’s case to begin cutting interest rates at its mid-September Federal Open Market Committee meeting.
- On a positive note, U.S. retail sales surged in July at the quickest rate since early 2023, even as consumers contended with higher borrowing costs and a slowing labor market. The July retail sales report shows that overall sales grew by 1% compared to the previous month, driven by a strong recovery in vehicle sales, while sales excluding autos and energy increased by 0.4%.

- Stock markets across the globe experienced volatility in early August, but the Japanese benchmark index, the Nikkei 225 saw some of the most extreme moves. On 8/5/24 the Nikkei 225 was down 12% in a single day. This was the largest single-date decline since 1987. The catalyst was the Bank of Japan unexpectedly raising interest rates.
- To underscore the volatility in U.S. markets, the Russell 2000 index, a basket of smaller companies that are generally thought to be more sensitive to economic growth, has seen 3 separate swings of 8-10%, both up and down, since the beginning of July.
- The combination of slowing economic data, equity market volatility, and increased expectations for the Federal Reserve to cut interest rates led to the 10-Year Treasury yield falling from over 4% at the end of July down to 3.80% as of 8/23/24.

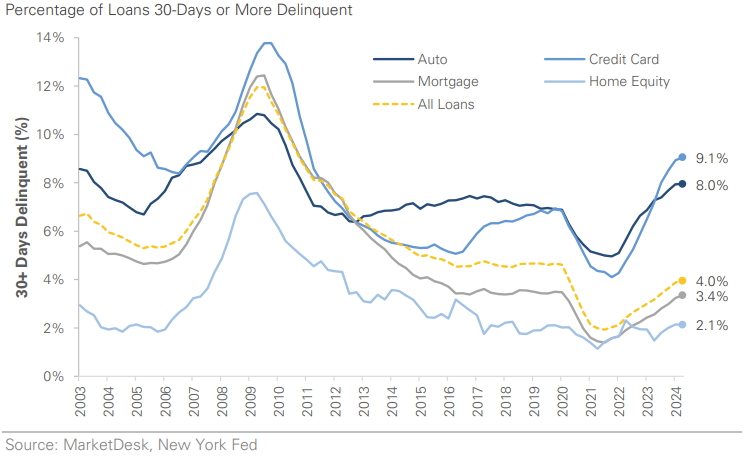
In tandem with ongoing consumer spending, delinquency rates have been climbing steadily since Q4 2021, following a drop to multi-decade lows during the pandemic. The increase is most notable in credit cards and auto loans, both of which have surpassed pre-pandemic levels. While mortgage and home equity delinquencies have also risen, they remain below pre-pandemic levels. This uptick in delinquencies has sparked concerns about the financial health of consumers.

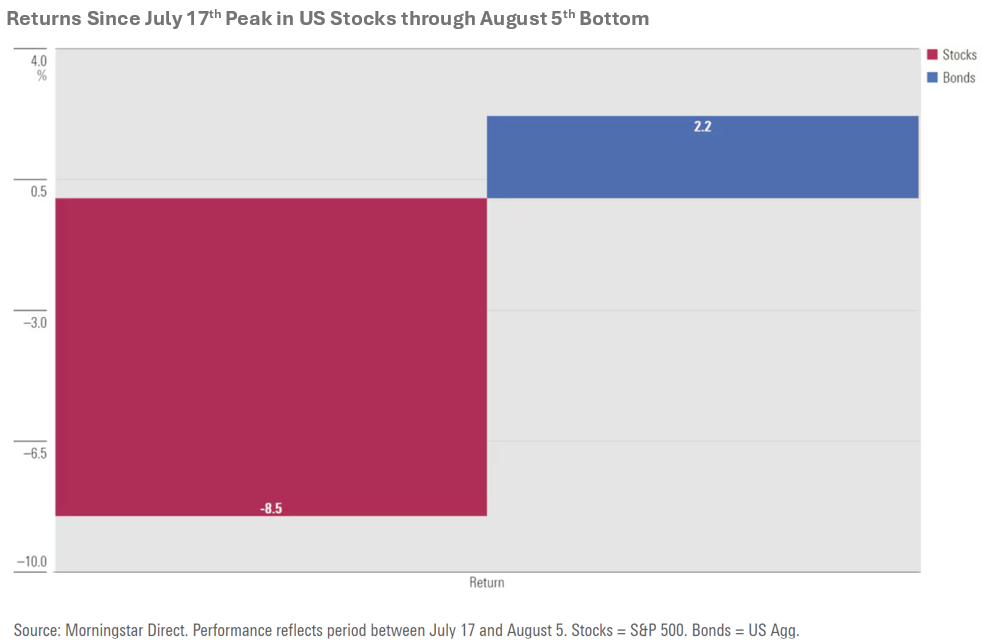
The increase in interest rates over the past several years initially hurt bond investors, given bond prices fall when rates rise. However, the higher rates have since started to benefit bond investors, and the positive effects are becoming evident. After the S&P 500 peaked in July, it experienced a peak-to-trough decline of 8.5% through August 5. In contrast, bonds posted gains of over 2% during this period. A closer look at the most volatile days during this time provides even more insight: the S&P 500 had three separate trading days with declines of 2% or more, and on each of those days, bonds outperformed stocks. This underscores the importance of diversification, especially in light of ongoing debates about the role of bonds in a portfolio since the 2022 bear market.

The market volatility this month disappeared as quickly as it arrived, with the S&P 500 now just 0.58% (as of 8/23/24) off its all-time high reached on 7/16/24. Now with recent inflation data trending lower and labor market data weakening, the window is as open as it’s been for the Federal Reserve to cut interest rates next month. That narrative and expectation for lower rates will likely continue to be a primary driver in this buoyant market. In the near term, we expect the market will shift the magnifying glass from inflation over to the labor market. The recent downward revision to the job numbers made by the Bureau of Labor Statistics, indicates the labor market is not as resilient as many thought. This comes on the heels of the ‘Sahm Rule’ triggering; an economic indicator that states when the three-month average U.S. unemployment rate rises by 0.50% or more from its 12-month low, the economy is in a recession. The creator of the indicator, economist Claudia Sahm, however, has recently stated she believes the indicator is likely being skewed by the unusual disruptions of the past four and a half years and doesn’t think the U.S. is in a recession. The stock market appears to be in agreement. If the labor market does not weaken significantly from here, then the Federal Reserve may have successfully navigated a ‘soft landing’ and avoided a recession. But with some of the employment data now showing more cracks, we don’t believe we have an ‘all clear’ signal.
The purpose of the update is to share some of our current views and research. Although we make every effort to be accurate in our content, the data is derived from other sources. While we believe these sources to be reliable, we cannot guarantee their validity. Charts and tables shown above are for informational purposes, and are not recommendations for investment in any specific security.