

Our current stock allocation is in an Over Weight position. This allocation of stocks vs. bonds is driven by technical market signals. These signals may lead to a shift in stock weightings in SFMG portfolios’ target allocations. This is not meant to be a specific allocation recommendation as this may vary across client portfolios.

- U.S.–Iran tensions fluctuated between signs of diplomatic progress and continued on-the-ground strain. The headline development was positive, with Trump extending the ceasefire on an open-ended basis. However, underlying conditions remained fragile: the U.S. naval blockade of Iranian ports persisted, planned peace talks were called off, and uncertainty grew around Iran’s leadership dynamics.
- Industrial production declined in March following several months of growth. The drop occurred amid oil price volatility and geopolitical uncertainty, as rising energy costs and supply chain disruptions weighed on manufacturing. While this suggests a more cautious underlying economic outlook despite record highs in equity markets, newer data points to improvement. The April Philly Fed Manufacturing Index exceeded expectations, indicating that activity has picked up as tensions have eased and energy prices have declined.
- Optimism around increased in-market consolidation in the European Union has grown following reports that the European Commission may pursue a meaningful relaxation of merger rules—potentially the most significant in decades—to enhance competitiveness and support the emergence of “European champions” capable of competing with U.S. and Chinese peers. While the proposal, backed by Commission President Ursula von der Leyen, still faces some debate among member states and within the Commission, the overall direction signals a constructive step toward strengthening Europe’s corporate landscape.

- The S&P 500 and Nasdaq both reached fresh all-time highs this month, supported by the extension of the ceasefire and a strong start to the first-quarter earnings season. Notably, the S&P 500 moved above 7,000 for the first time since late January, completing an 11-session V-shaped recovery from the late-March low and fully reversing a nearly 10% drawdown. The Nasdaq also posted 11 consecutive daily gains, marking its longest winning streak since 2020.
- The semiconductor sector has been a standout performer in April, with the PHLX Semiconductor Sector Index (SOX) logging 18 consecutive trading days of gains — the longest winning streak in its 32-year history. Over that stretch, from 3/30/26 – 4/24/26, the index surged an impressive 47.2%. The rally was fueled by a combination of robust AI infrastructure investment, stronger-than-expected earnings and forward guidance, and a string of positive developments from major chip companies.
- U.S. Treasury yields moved higher amid ongoing Middle East tensions, which pushed oil prices up and kept inflation concerns elevated. The 2-year and 10-year Treasury yields rose to 3.78% and 4.30%, respectively in the week ending 4/24/26. European yields followed a similar path, with inflation worries lifting the 10-year German Bund yield to 2.99% ahead of this week’s ECB meeting.

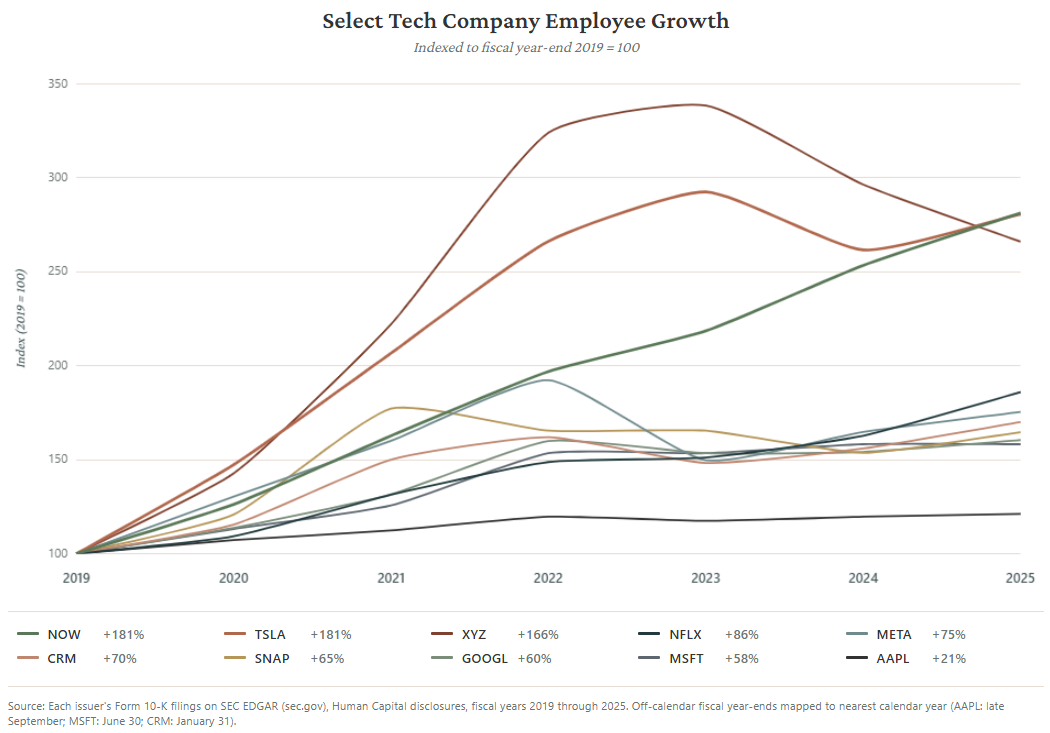
Meta Platforms and Microsoft recently announced workforce reductions of roughly 10% and 7%, respectively, joining earlier cost-cutting moves by firms like Oracle, Snap, and Amazon. Despite these layoffs, broader employment indicators remain stable, supporting the view that the U.S. labor market is in a “no hire, no fire” phase. While AI adoption is often cited as a driver, these cuts more likely reflect a normalization after the rapid hiring seen during the COVID-19 period, as companies streamline toward more efficient staffing levels.


Private credit is facing increased scrutiny, with concerns about defaults, credit quality, and limited liquidity gaining attention. Some fears stem from a few unexpected bankruptcies and a broader reassessment of software sector exposure after recent market declines. However, recent data shows that fundamentals remain stable, with default rates around 2%—similar to high-yield bonds—and returns still outperforming public markets. While certain risks have risen since 2022 due to higher interest rates, they have not worsened significantly in the past year. Overall, despite pockets of concern, there is no clear evidence of widespread deterioration in private credit performance.

Financial markets appear to be adapting to the ongoing conflict in the Middle East in much the same way they adjusted to the Russia-Ukraine war, treating it as a persistent backdrop rather than an acute market shock. U.S. equities have led the recovery since bottoming on March 30, returning to positive territory as investors grow more confident that the conflict is unlikely to derail broader economic or earnings growth. The AI investment theme has re-emerged as a primary market driver, with technology, communication services, and consumer discretionary sectors leading gains, the same areas that bore the brunt of the earlier drawdown due to previously stretched valuations. Rate sensitive assets, however, have been slower to recover. While growth fears have largely faded, inflation remains a central concern for investors. The March Consumer Price Index reading increased 0.9% month over month, the largest gain since mid-2022. Much of the increase was due to a 10.9% jump in energy costs, led by significant rises in gasoline prices. Outside of energy, price pressures remained contained. Core CPI, which excludes food and energy, rose a modest 0.2%, in line with recent trends, and food prices were unchanged, suggesting limited immediate spillover from higher energy costs so far. However, the Strait of Hormuz remains effectively closed. Additional disruptions to energy infrastructure, shipping, and broader supply chains could keep upward pressure on prices in the months ahead, alongside ongoing tariff related effects. This has dampened enthusiasm around expectations for Federal Reserve rate cuts. The longer energy prices remain elevated, the greater the risk of broader inflation spillover, along with the potential for higher bond yields and lower equity prices.
The purpose of the update is to share some of our current views and research. Although we make every effort to be accurate in our content, the data is derived from other sources. While we believe these sources to be reliable, we cannot guarantee their validity. Charts and tables shown above are for informational purposes, and are not recommendations for investment in any specific security. Forward-looking statements are based on current expectations and assumptions and are subject to risks and uncertainties that may cause actual results to differ materially.