

Our current stock allocation is in an Over Weight position. This allocation of stocks vs. bonds is driven by technical market signals. These signals may lead to a shift in stock weightings in SFMG portfolios’ target allocations. This is not meant to be a specific allocation recommendation as this may vary across client portfolios.

- The Fed cut rates by 0.25% to a 3.50%–3.75% range in December, but signaled the easing cycle is now on hold, noting it will reassess the timing and extent of further cuts. The Fed also announced $40B per month in T-bill purchases through early 2026 to support bank reserves. Chair Powell struck a more optimistic tone about future cuts than expected, citing softer underlying employment trends, easing wage pressures, and inflation largely driven by tariff passthrough expected to peak in Q1 2026.
- The Bureau of Labor Statistics data released on 12/16 showed further cooling in the labor market, with unemployment rising to 4.6% in November, partly driven by higher labor force participation rather than layoffs. October payroll figures were distorted by delayed reporting tied to federal job cuts and deferred resignations that officially rolled off payrolls in October, making that month’s decline appear worse than underlying conditions.
- Small-business optimism edged higher in November, according to the NFIB Small Business Survey, driven primarily by improved sales expectations. While hiring and capital spending plans remain muted, the data suggest small firms are cautiously confident about near-term demand. Overall, sentiment points to steady but measured optimism as businesses continue to manage costs and labor challenges carefully.

- The S&P 500 posted a seventh consecutive monthly gain through November, despite uncertainty around Fed policy and Artificial Intelligence fatigue. Early losses in mega-cap tech nearly interrupted the index’s winning streak, but a cooler-than-expected inflation report, rising unemployment, and dovish Fed commentary raised expectations for a December rate cut, helping to stabilize the market.
- Despite the Federal Reserve cutting short-term interest rates at its December meeting, longer-term yields—driven more by growth and inflation expectations—have remained stubbornly above 4%, with the 10-year Treasury rising to an intraday high of 4.21% on 12/10, its highest level in three months. Persistent concerns around U.S. fiscal deficits, inflation pressures, and resilient economic growth are likely contributing to the elevated level of long-term rates.
- Small- and mid-cap stocks have shown leadership in December, with the S&P MidCap 400 and S&P SmallCap 600 rising 2.68% and 3.05%, respectively, compared to the S&P 500’s 0.97% gain (12/1–12/22). The lower short-term rates may be supporting this rally, as smaller companies are more sensitive to financing costs, which can impact profit margins.

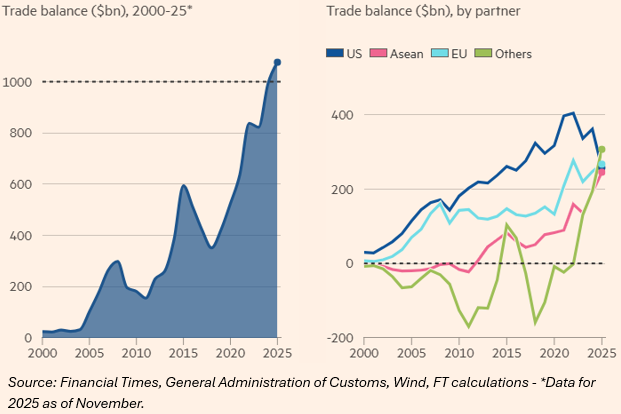
China’s goods trade surplus surpassed $1 trillion for the first time, reaching $1.076 trillion in the first 11 months of the year, despite ongoing trade tensions stemming from U.S. tariffs imposed under President Trump. Export growth has increasingly shifted away from the U.S., with November exports rising 5.9% year over year—beating expectations—driven by stronger demand from the EU and Southeast Asia, which more than offset declines in shipments to the U.S.

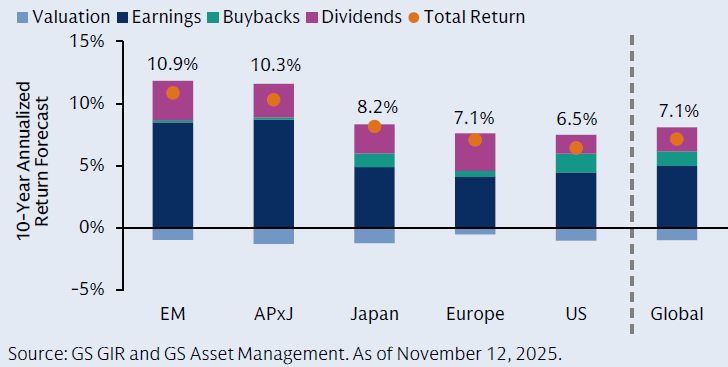
Heading into the new year, many investment institutions refresh their expected return forecasts. Despite elevated valuations, global equities are expected to deliver strong long-term returns, supported by earnings growth, improved productivity, and shareholder distributions. Goldman Sachs notes that US equities are projected to return around 6.5% over 10 years, but high concentration and full valuations highlight the importance of diversification. International and emerging market equities may offer opportunities from strong economic growth, structural reforms, and potential currency tailwinds, while Artificial Intelligence trends could eventually drive growth across regions beyond US tech.

Markets are threading a narrow path between slowing growth, AI-driven optimism, and accommodative Fed policy, with investors pricing in a near-perfect scenario: a soft landing, resilient earnings, sustained AI spending, and continued rate cuts. This leaves little room for disappointment, as elevated valuations and concentrated market leadership create conditions in which any stumble—whether weaker labor data, softer consumer spending, or doubts about AI economics—could quickly unsettle sentiment. November’s volatility, sparked by uncertainty around the Fed’s December decision, underscored just how fragile the current backdrop has become. Looking beyond the near term, the outlook remains cautiously optimistic but tempered by the recognition that markets are pricing in a significant amount of good news. The expansion remains resilient but increasingly dependent on a few key pillars—Fed cuts, AI spending, and above-average earnings growth—making it vulnerable to disappointment on any front. As the outlook extends toward 2026, fiscal policy may provide meaningful support. Investment incentives and tax cuts from the One Big Beautiful Bill Act, including full expensing for Research & Development (R&D) and capital spending, are expected to drive U.S. real Gross Domestic Product (GDP) growth above consensus at 2.6%, potentially offsetting headwinds from tariffs and spending cuts. This improving fiscal backdrop should underpin markets and create opportunities across asset classes, particularly outside U.S. large caps, where shifting leadership patterns suggest investors are beginning to seek more compelling valuations and a broader foundation beyond the AI narrative. The environment remains constructive but one that calls for selectivity rather than aggressive positioning.
The purpose of the update is to share some of our current views and research. Although we make every effort to be accurate in our content, the data is derived from other sources. While we believe these sources to be reliable, we cannot guarantee their validity. Charts and tables shown above are for informational purposes, and are not recommendations for investment in any specific security.