
Our current stock allocation is in an Over Weight position. This allocation of stocks vs. bonds is driven by many variables we monitor, including our risk signals. These signals may lead to a shift in stock weightings in SFMG portfolios’ target allocations. This is not meant to be a specific allocation recommendation as this may vary across client portfolios.

- Following a significant 0.50% rate cut in September, the Fed implemented a 0.25% reduction on November 7, lowering its policy rate target to a range of 4.50% to 4.75%. Fed officials highlighted uncertainty about the economy’s trajectory, the extent to which current interest rates were constraining growth, and the need to proceed cautiously in determining any further rate cuts.
- The European economy grew by 0.4% in the third quarter, according to preliminary data from the European Union, exceeding expectations and building on 0.3% growth in the second quarter. Germany, the bloc’s largest economy, posted unexpected growth of 0.2%, avoiding an anticipated recession by economists, despite ongoing challenges in its key manufacturing sector.
- U.S. Retail sales rose 0.4% last month, exceeding expectations, and came with an upward revision to September’s data. This points to stronger third quarter economic growth and implies a solid start to the fourth quarter. Despite interest rates and inflation rates still above pre-pandemic levels, consumer spending has remained intact.

- Treasury yields climbed both before and after the election. While stronger economic data following August’s labor market concerns has been a major driver, the anticipated ‘pro-growth’ policies of the incoming administration have also played a significant role.
- The stock market has also been on the rise following the election, with the S&P 500 reaching a new milestone, closing above 6,000 for the first time on 11/11/24. This level has been hit just 9 months after surpassing 5,000 in February of this year. Historically, it can take multiple years to see the index cross the major ‘thousand’ level thresholds.
- Non-U.S. stocks have struggled under the threat of tariffs this month and the impact they may have on global trade, particularly in Europe and China. European and Chinese equities, measured by the iShares Europe ETF (ticker: IEV) and the iShares MSCI China ETF (ticker: MCHI), have underperformed the S&P 500 by -4.22% and -8.78% respectively since 11/6/24.


A record 51.4% of Conference Board respondents now expect higher stock prices in the next year, up from last month’s previous high. This is concerning from a contrarian point of view. With so many investors overly bullish, who will continue to buy at these price levels? Historically though, such optimism has not been a reliable indicator of future returns – good or bad. Notably, after President-Elect Trump’s prior election win, this index similarly jumped from 30.9% to 47.1% over four months.


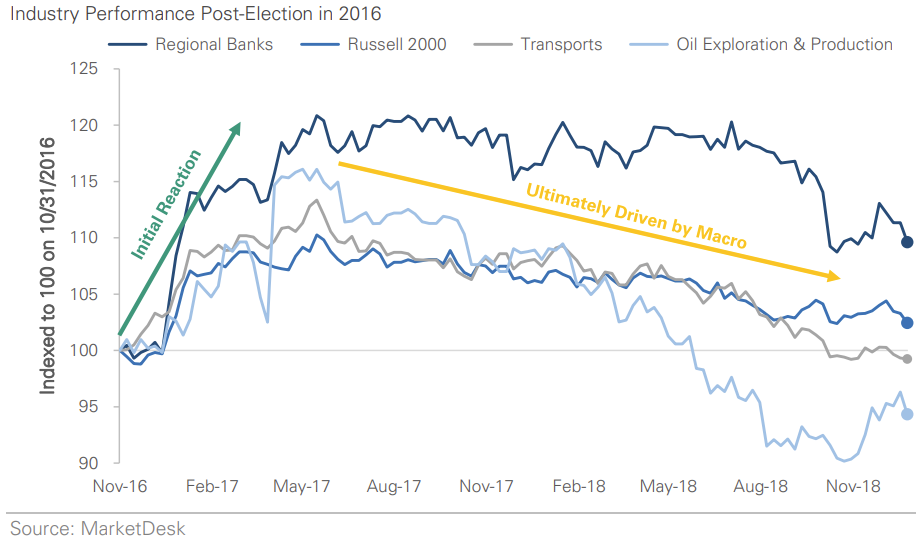
The graph above compares the relative price returns of key 2016 “Trump trades” — regional banks, small caps, transports, and energy companies — to the S&P 500, indexed to 100 as of October 31, 2016. These sectors saw rapid and significant outperformance after the election, peaking by mid-2017 before retreating over the next 19 months as policies materialized and fundamentals took precedence. Many of these same industries have jumped following this year’s election. While market narratives may drive early reactions to a new administration, history shows that policy expectations are quickly priced in, but may not last.

U.S. equity markets continued their rally after the presidential election, fueled by optimism about lower corporate taxes, reduced regulation, and other pro-growth policies. A 0.25% rate cut by the Fed on November 7 added momentum. Historically, the November-to-January period has been favorable for equities, and current conditions appear supportive. However, today’s environment is markedly different from when Trump was first elected in 2016. In 2017, U.S. stocks, measured by the Price-to-Earnings (P/E) ratio, were valued below their long-term average at around 16.3x forward earnings, compared to over 22x now. Inflation was not a concern, and interest rates were below 2.0%, whereas inflation remains above the Fed’s 2% target, and the 10-year Treasury yield is around 4.25%. Additionally, the fiscal deficit as a percentage of GDP has roughly doubled since Trump’s first term. These factors suggest the need for tempered expectations and vigilance regarding market risks, including a potential spike in long-term interest rates. The 10-year yield has risen post-election and could climb further if fiscal spending priorities under President-Elect Trump put unexpected upward pressure on rates. Similarly, tariffs could likely add to inflationary pressures. As long as the economy continues to demonstrate resilience, this level of interest rates and inflation may not derail the market. However, we remain attentive to the evolving likelihood of new policies and spending initiatives under this administration.
The purpose of the update is to share some of our current views and research. Although we make every effort to be accurate in our content, the data is derived from other sources. While we believe these sources to be reliable, we cannot guarantee their validity. Charts and tables shown above are for informational purposes, and are not recommendations for investment in any specific security.
